


Display and video ad campaigns showcase your business where it matters most as potential customers scroll online. These media-rich ads are frequently a top-choice strategy for growing businesses because of their high success rates, with 74% of small businesses satisfied with their display advertising results.
So, how many clicks do the typical display campaigns get? And how much do those clicks cost? Or, what percentage of video ad viewers are actually watching them all the way through?
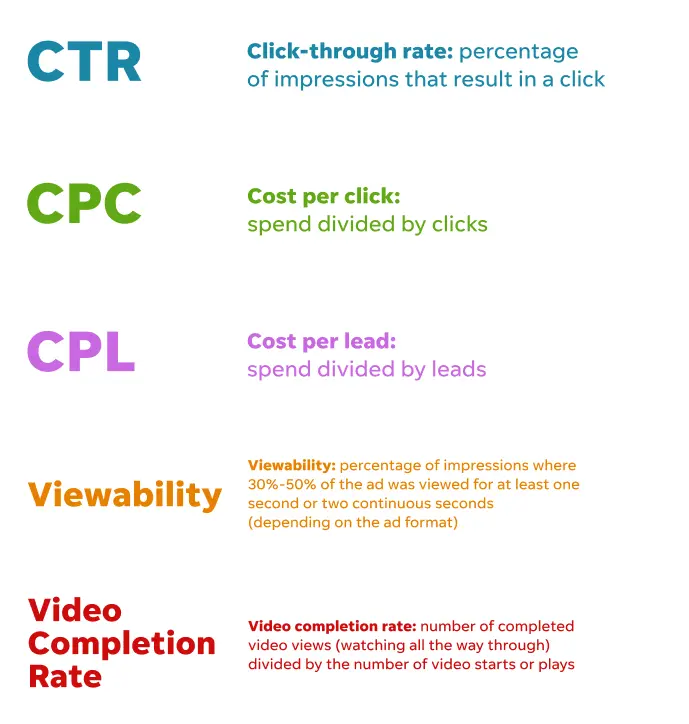
We uncovered the answers to these questions by analyzing over 60,000 LocaliQ display and video ad campaigns from two different data sources to create our first-ever Display and Video Advertising Benchmarks. You’ll gain insight into key metrics including click-through rate, cost per click, cost per lead, viewability, and video completion rate, plus ideas to improve your strategy.
Contents
- What to know about our display and video benchmarks data
- Display and video ads benchmarks by industry
- Display and video benchmarks: Overall averages for USA TODAY Network ad formats
- How to improve your business’s display and video ads
🏃 On the go? Take this data with you! Download our free 2026 display and video ads benchmarks report here.
What to know about our display and video benchmarks data
The data in this report is split two ways: industry benchmarks covering display ads running on over 350 properties, then overall performance averages for display ads running solely across the USA TODAY Network. Each data set covers display and video metrics specific to the nature of programmatic campaigns:
- Display ad industry metrics include average click-through rate, average cost per click, and average cost per lead.
- High-impact, video, and native display ads metrics include click-through rate, video completion rate, and viewability.
Display and video ads benchmarks by industry
Let’s first take a look at click-through rate, cost per click, and cost per lead for standard display campaigns broken down by industry. These ads run on hundreds of exchanges, networks, and publishers, including Google, YouTube, Meta, and Yahoo, and include multiple formats, such as banner ads, video, and more.
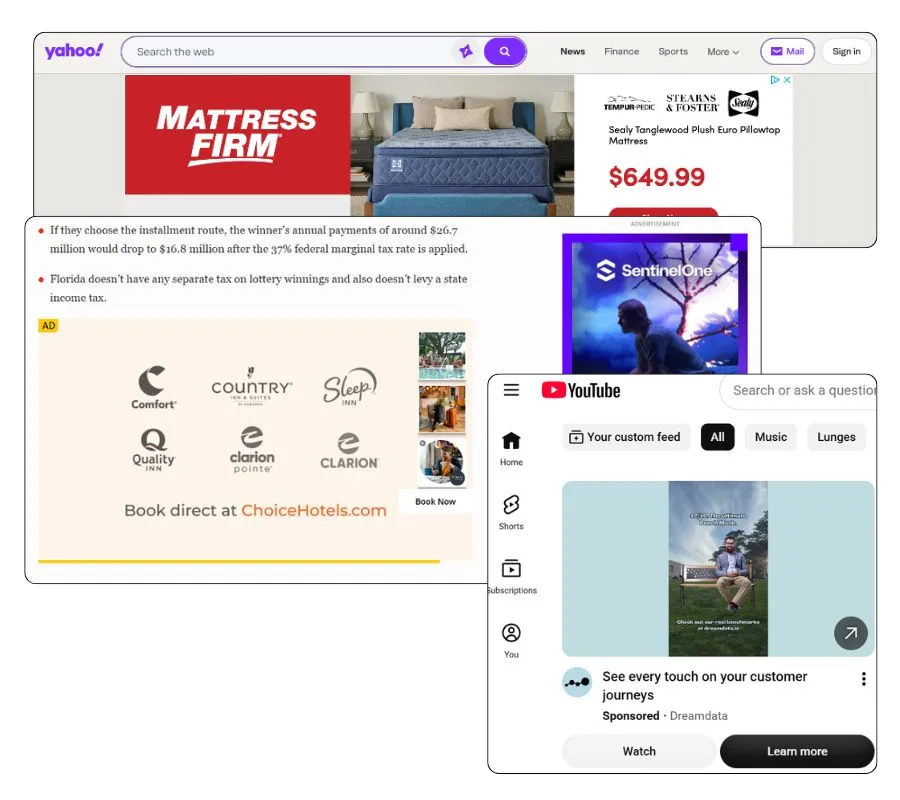
Examples of display ads in the wild.
Here is a view of all industries and all metrics we looked at for this data set.
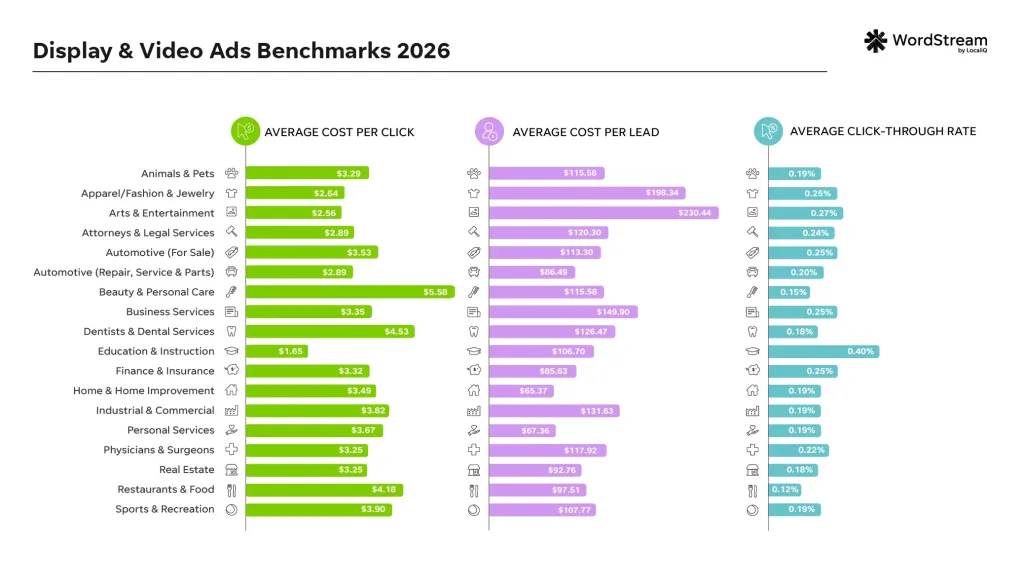
The industries with the highest click-through rate for display ads were Education and Instruction at 0.40% and Arts and Entertainment at 0.27%. Arts and Entertainment is a very visual industry to begin with, so it makes sense that people would be more likely to click on those ads.
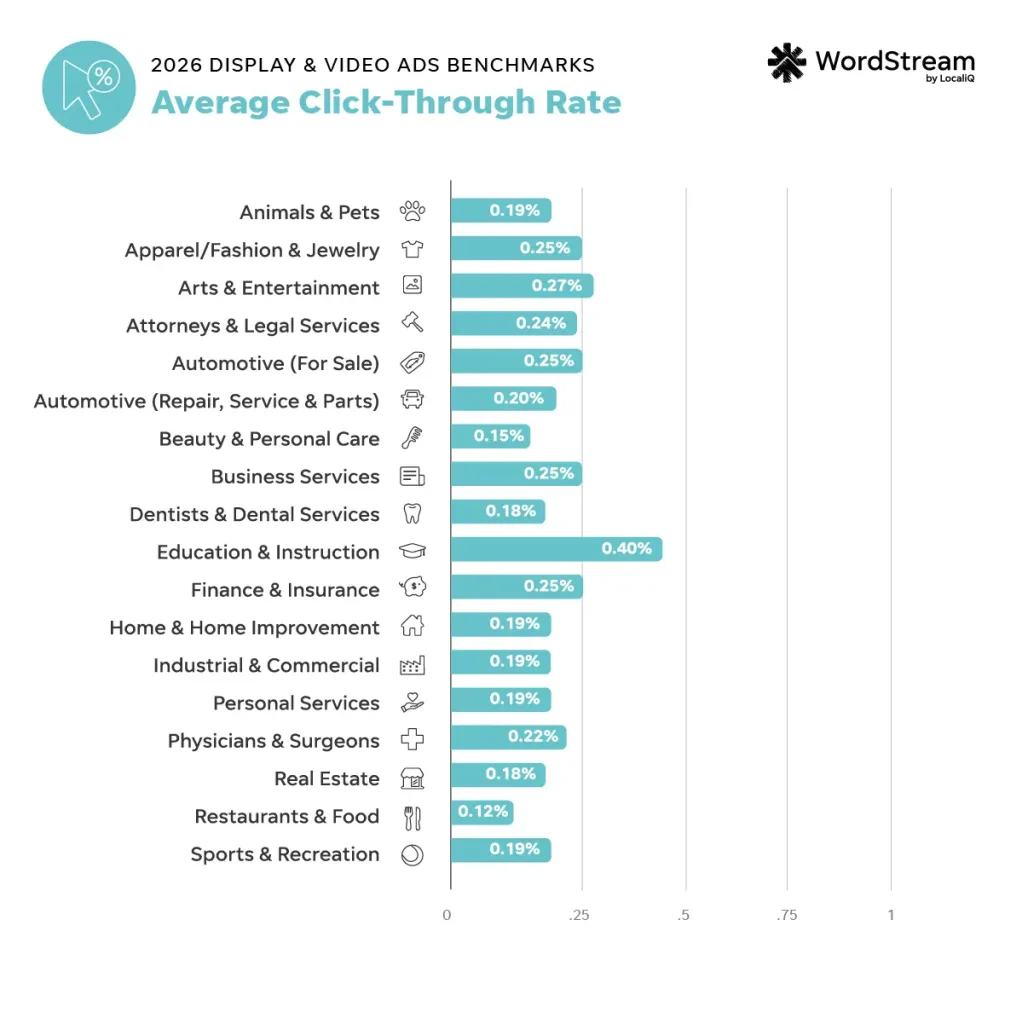
| Business category | Average click-through rate |
| Animals & Pets | 0.19% |
| Apparel / Fashion & Jewelry | 0.25% |
| Arts & Entertainment | 0.27% |
| Attorneys & Legal Services | 0.24% |
| Automotive — For Sale | 0.25% |
| Automotive — Repair, Service & Parts | 0.20% |
| Beauty & Personal Care | 0.15% |
| Business Services | 0.25% |
| Dentists & Dental Services | 0.18% |
| Education & Instruction | 0.40% |
| Finance & Insurance | 0.25% |
| Home & Home Improvement | 0.19% |
| Industrial & Commercial | 0.19% |
| Personal Services | 0.19% |
| Physicians & Surgeons | 0.22% |
| Real Estate | 0.18% |
| Restaurants & Food | 0.12% |
| Sports & Recreation | 0.19% |
As for display and video cost per click, there is also some variation by industry. Typically, clicks are cheaper for this ad type compared to search ads. Beauty and Personal Care had the highest cost per click at $5.58, which checks out, as this particular industry is extremely competitive.
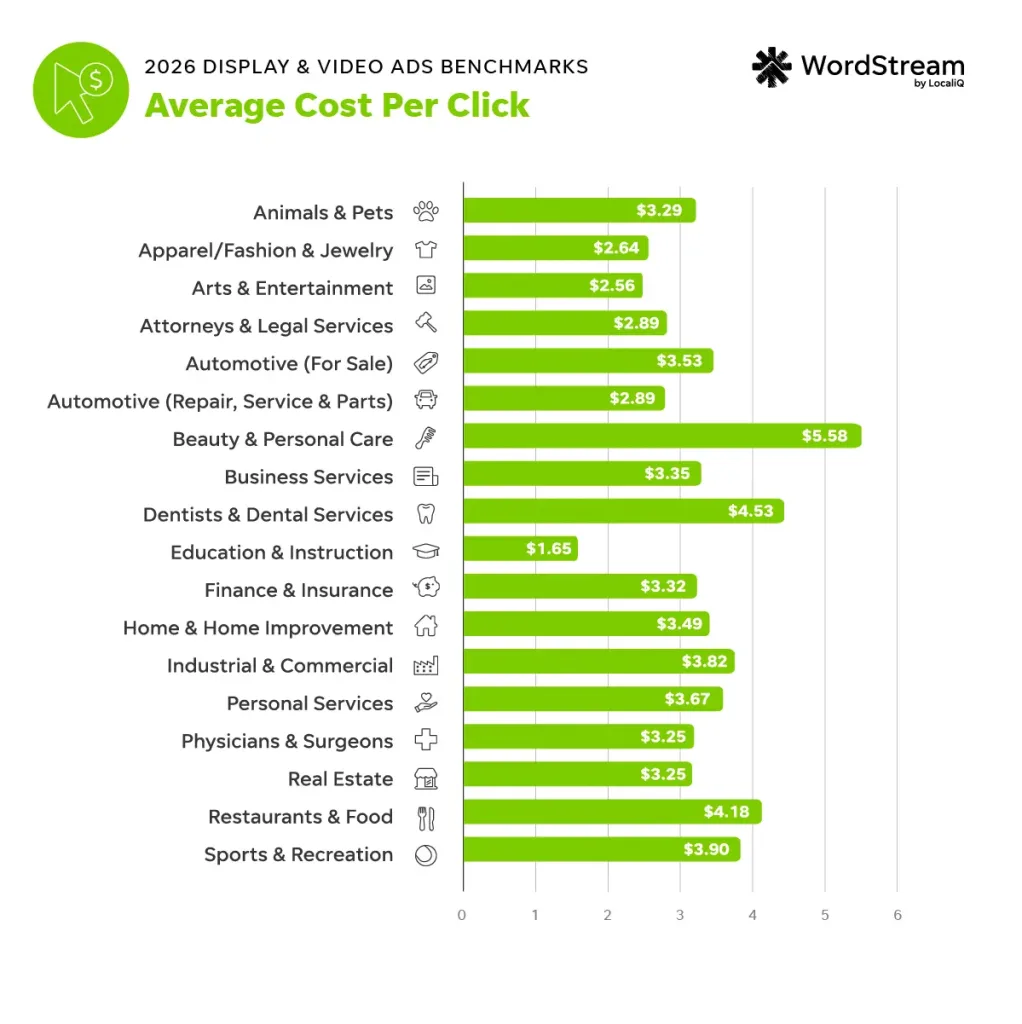
| Business category | Average cost per click |
| Animals & Pets | $3.29 |
| Apparel / Fashion & Jewelry | $2.64 |
| Arts & Entertainment | $2.56 |
| Attorneys & Legal Services | $2.89 |
| Automotive — For Sale | $3.53 |
| Automotive — Repair, Service & Parts | $2.89 |
| Beauty & Personal Care | $5.58 |
| Business Services | $3.35 |
| Dentists & Dental Services | $4.53 |
| Education & Instruction | $1.65 |
| Finance & Insurance | $3.32 |
| Home & Home Improvement | $3.49 |
| Industrial & Commercial | $3.82 |
| Personal Services | $3.67 |
| Physicians & Surgeons | $3.25 |
| Real Estate | $3.25 |
| Restaurants & Food | $4.18 |
| Sports & Recreation | $3.90 |
When evaluating cost per lead, it’s important to remember that display advertising can influence customers before they’re ready to convert, which is a strategy known as pre-marketing. However, since programmatic campaigns can still connect back to leads in an impactful way, it’s always a good idea to check on this metric every so often when running display or video ads. The industry with the highest cost per lead for video and display ads in 2026 was Arts and Entertainment at $230.44. In contrast, Home and Home Improvement was the industry with the lowest CPL at $65.37.
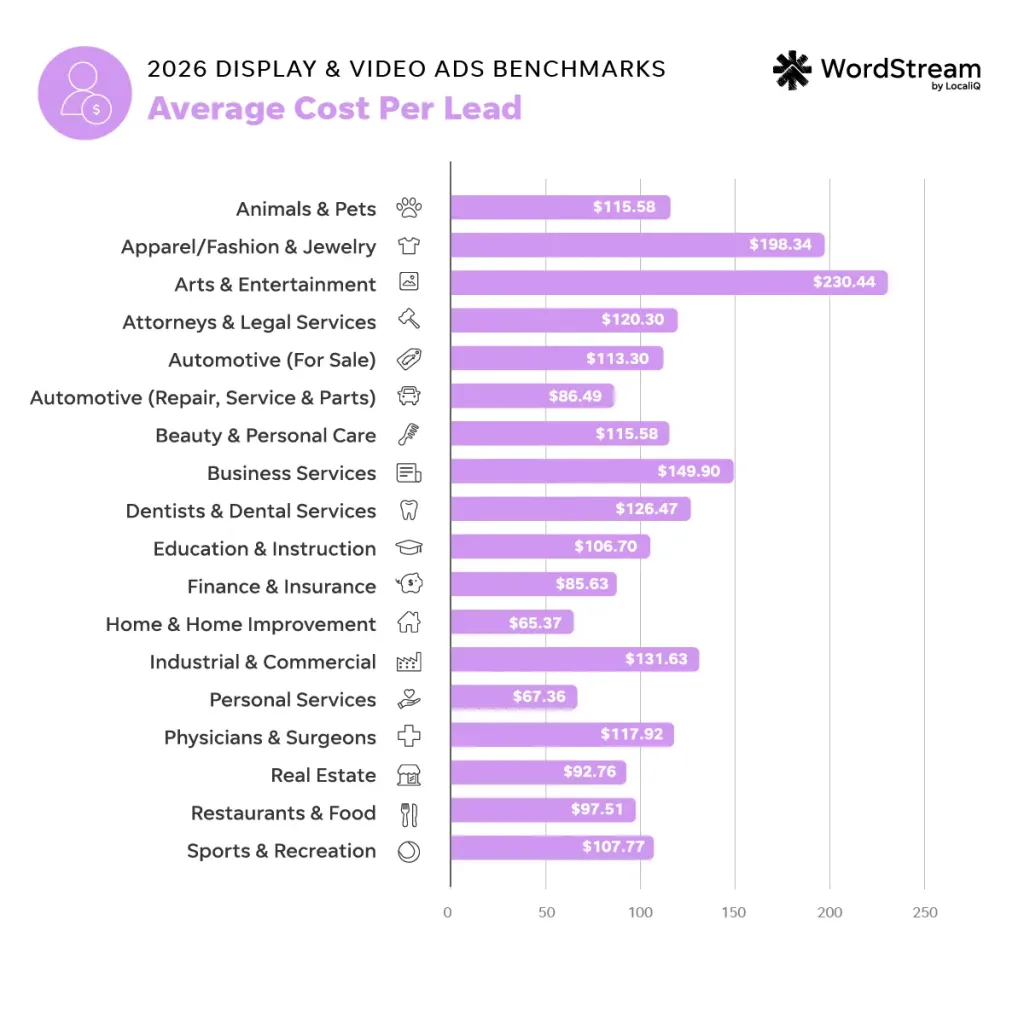
| Business category | Average cost per lead |
| Animals & Pets | $115.58 |
| Apparel / Fashion & Jewelry | $198.34 |
| Arts & Entertainment | $230.44 |
| Attorneys & Legal Services | $120.30 |
| Automotive — For Sale | $113.30 |
| Automotive — Repair, Service & Parts | $86.49 |
| Beauty & Personal Care | $115.58 |
| Business Services | $149.90 |
| Dentists & Dental Services | $126.47 |
| Education & Instruction | $106.70 |
| Finance & Insurance | $85.63 |
| Home & Home Improvement | $65.37 |
| Industrial & Commercial | $131.63 |
| Personal Services | $67.36 |
| Physicians & Surgeons | $117.92 |
| Real Estate | $92.76 |
| Restaurants & Food | $97.51 |
| Sports & Recreation | $107.77 |
⚡ Want to optimize your Google display and video ads fast? Start with a free, instant account report using our Google Ads Grader!
Display and video benchmarks: Overall averages for USA TODAY Network ad formats
Now that I’ve gone through our industry-specific data for general display and video ad campaigns, time to get into performance averages for ads running specifically on the USA TODAY Network!
High-impact display ads benchmarks
High-impact display ads use larger, more visible placements to capture attention. On the USA TODAY Network, these ads can appear as full-screen or cinematic experiences and may include interactive elements, GIFs, and clickable features.
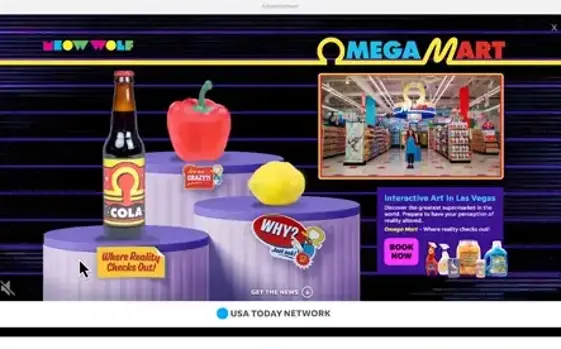
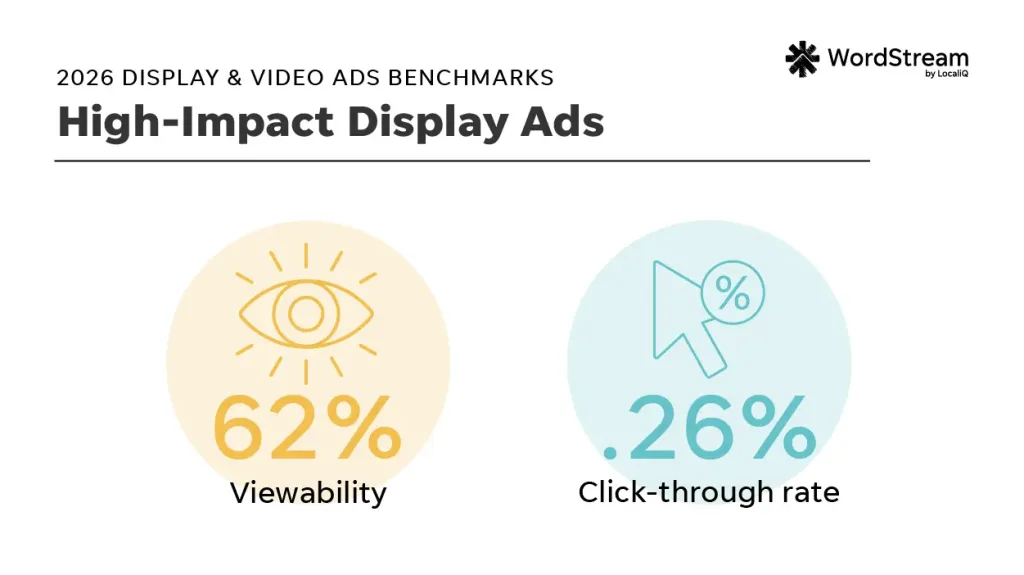
Here are the overall performance averages for high-impact ads on the USA Today Network in 2026:
- The average viewability rate for high-impact display ads is 62%.
- The average click-through rate for high-impact display ads is 0.26%.
Video display ads benchmarks
Video ads give businesses another way to capture attention and communicate their message through motion and sound. On the USA TODAY Network, video display ads are playable ads that viewers can watch, replay, and click.
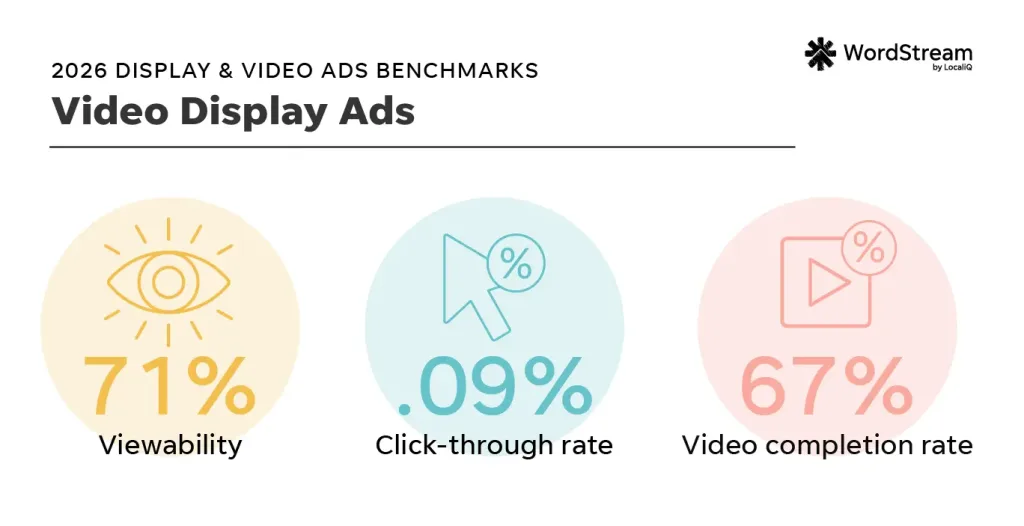
A typical video ad on the USA TODAY Network in 2026 performs as follows:
- The average viewability rate for video ads is 71%.
- The average click-through rate for video ads is 0.09%.
- The average video completion rate of video ads is 67%.
Since viewers tend to watch the video, absorb the content, and move on, a lower CTR isn’t a cause for concern with this ad type. Instead, video ads can still make a memorable impression for your brand, as viewers are more likely to come back to your business later after watching.
Native display ads benchmarks
Native display ads are designed to blend into the user experience. They can appear across headlines, articles, and newsletters, and put your message in front of audiences while they’re already engaged with content.

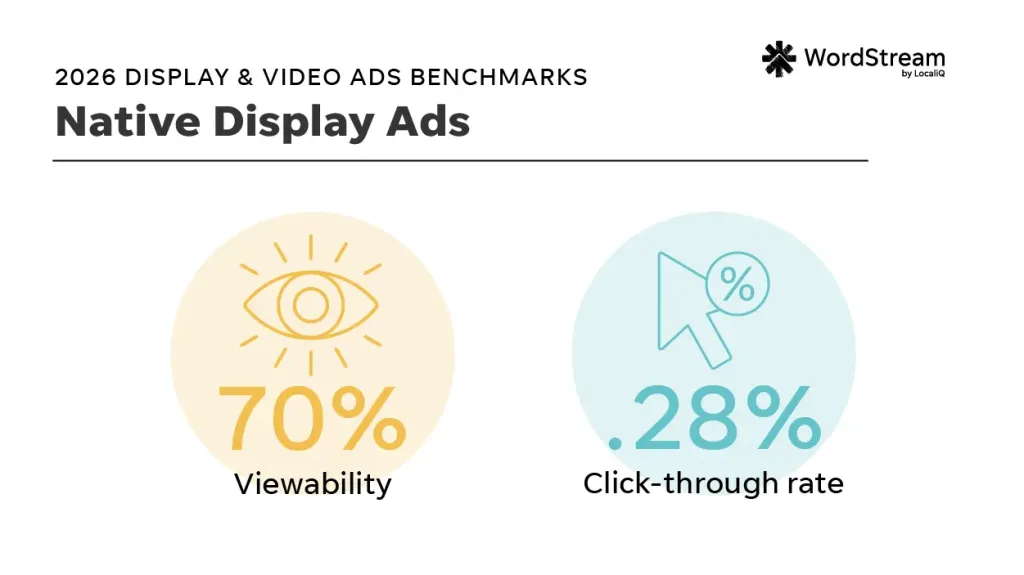
Native display ads performed similarly to the other USA TODAY Network ads we looked at. In 2026:
- The average viewability rate for native display ads is 70%.
- The average click-through rate for native display ads is 0.28%.
How to improve your business’s display and video ads
Here are a few display and video advertising tips to keep in mind.
1. Play around with placements
Taking advantage of different campaign placements for your display and video ads helps you reach your target audience more effectively.
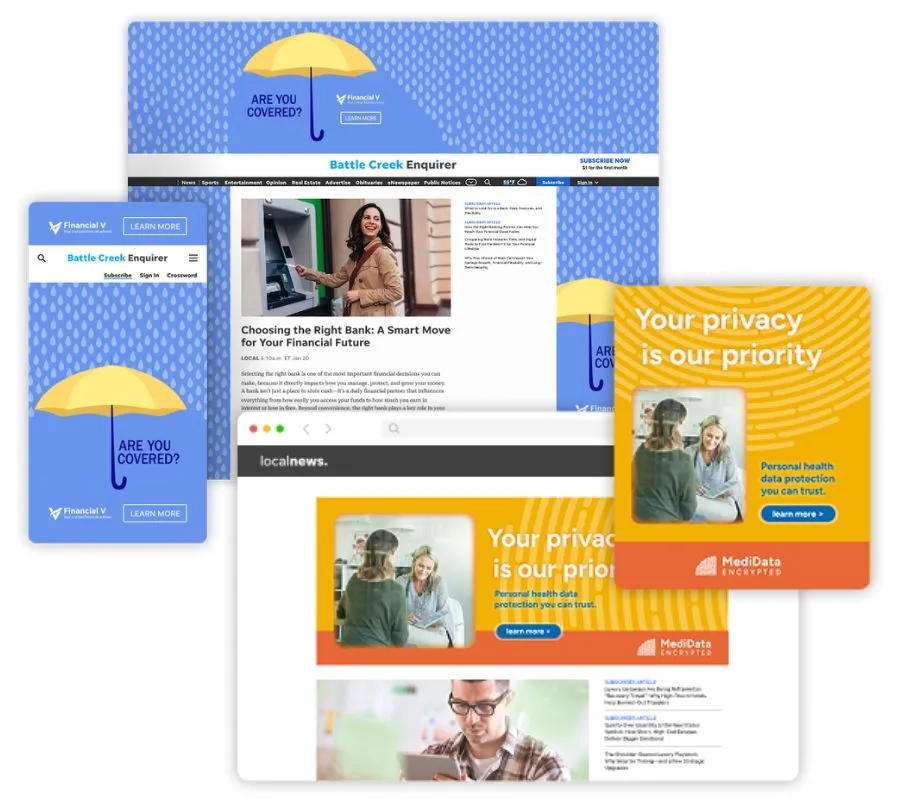
Make sure your display creative is flexible enough to work across the major placements and networks you can take advantage of, including the Google Display Network, YouTube, Microsoft Audience Network, the USA TODAY Network, and more.
2. Allocate your display budgets carefully
It can be easy to prioritize search when allocating your advertising budget, but display and search ads serve different purposes. Display ads can help build awareness and introduce your business to potential customers through pre-marketing, and bring previous visitors back through remarketing.
While display and video ads typically have lower CPCs than search advertising, display campaigns still need solid budgets since they are designed to generate impressions and views. Be sure you’re allocating enough budget to reach a meaningful audience and collect enough data to optimize your campaigns.
“One way to improve display performance is to have a larger budget allocated for these types of campaigns. More budget equates to more impressions, plus more data to optimize with,” said Rhett Chassereau, Supervisor of Programmatic Buying & Optimization at USA TODAY Co.
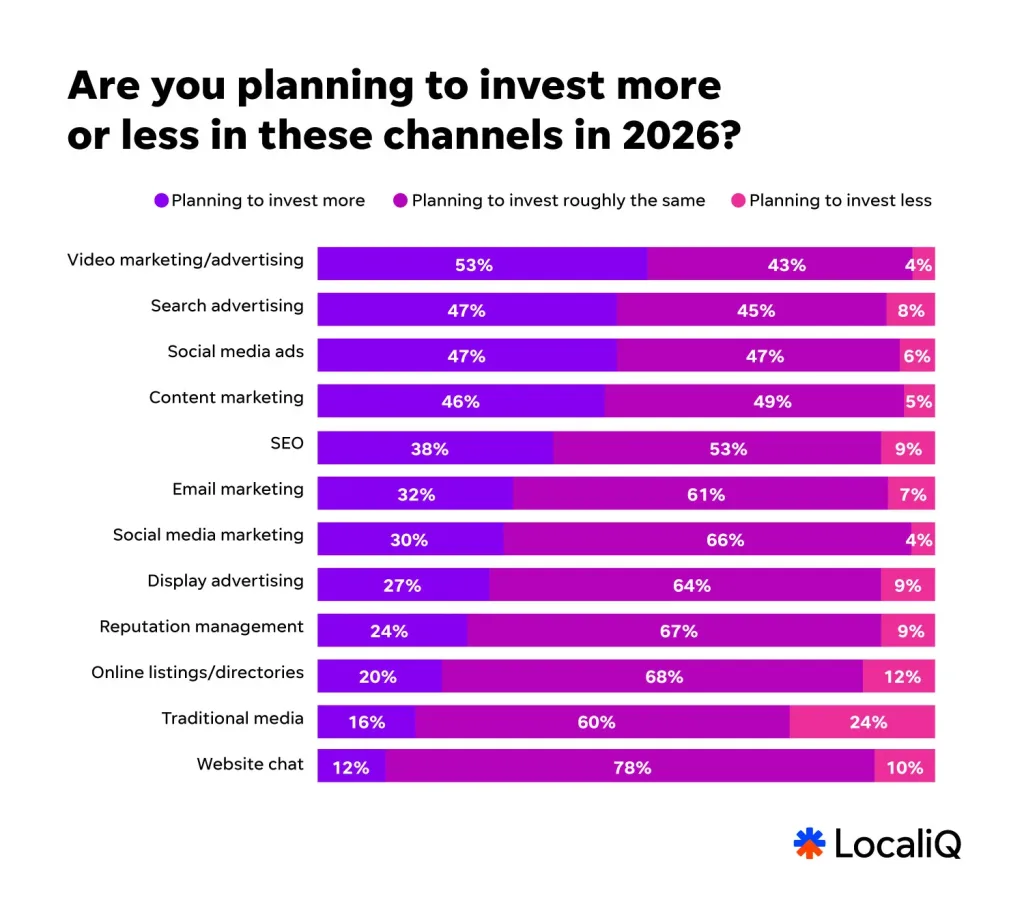
Optimizing your programmatic campaign budgets will help you stay competitive, too, as many small businesses are planning to invest more in video and display advertising this year.
3. A/B test often
Your display creative plays a major role in whether people notice and engage with your ads. You’ll want to be testing different images, messaging, calls to action, and other creative elements to see what resonates with your audience most.
Once you identify your strongest-performing ads, use them as a starting point for additional variations. Then, give your campaigns enough time to collect useful data, but continue monitoring individual ads so you can replace creative that consistently underperforms.

4. Scale campaigns using AI (with caution)
AI can help you scale your display and video ads with the right prompts. For instance, you could ask a couple of AI tools to brainstorm creative ideas or generate test variations.
However, you’ll want to be cautious and always review any AI-generated display or video assets before launch. A final manual review can help catch inaccurate, off-brand, or otherwise unfit AI elements before they reach your audience.
Try using this AI marketing checklist to help you use AI in your programmatic campaigns the right way.

Use this data to maximize your display and video campaigns
These display and video advertising benchmarks give you a starting point for evaluating your campaign performance. Use this data along with your own historical performance reports to guide your programmatic ad optimization. For more ways to maximize your display and video campaigns, see how our solutions can help!
About the data
The display and video ad industry data is pulled from 7,074 LocaliQ customer display advertising campaigns running from April 2025 through June 2026. High-impact, video, and native display ads benchmarks data is based on 55,798 location-based display advertising campaigns run on the USA TODAY Network between July 2025 and June 2026. “Averages” are technically median figures to account for outliers. All currency values are posted in USD.

Recommended for you





Unlock your business potential
We offer innovative technology and unparalleled expertise to move your business forward.