Google pulls in over a billion health-related searches each day, and 7% of all searches have to do with health. Many of these healthcare-related searches on Google or Bing happen at the exact moment someone is ready to book care. Naturally, advertising on platforms like Google Ads and Microsoft Ads ensures your practice shows up when those high-intent patients are actively looking for a provider.
But competition in healthcare search advertising is rising fast. As more practices emerge on the market and large healthcare systems increase their paid search investments, the cost of capturing patient attention can vary widely depending on specialty and more. It can be difficult to know for sure how your healthcare ads compare to competing providers, and if your campaigns are fully optimized toward your practice’s goals.
The right data can help you understand whether your ads need just a routine checkup or a visit to the search campaign emergency room. That’s why we’re releasing exclusive insights and data from over 3,500 healthcare campaigns to inform your search advertising strategy, so that you have everything you need to get your Google and Microsoft accounts into shape.
Contents
- Key takeaways
- Healthcare search ads benchmarks by metric
- Tips for healthcare practices to improve search ads campaigns
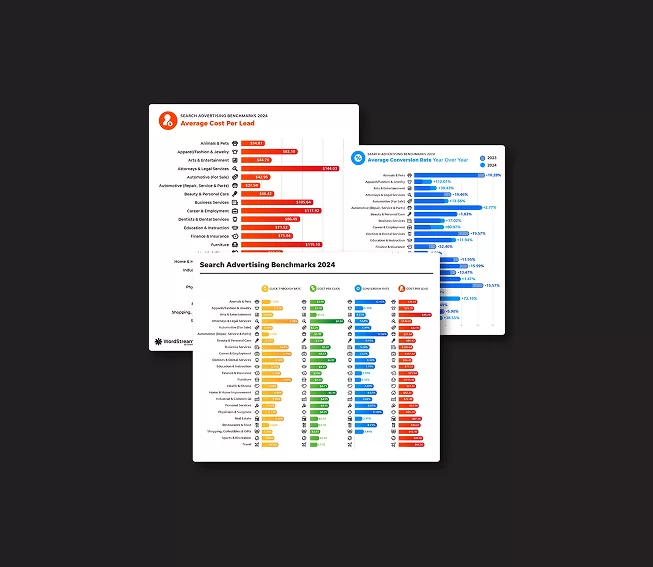
❓ Wondering how healthcare compares to other markets when it comes to advertising on Google and Microsoft? Download our latest, complete search ad benchmarks report for free here!
Search ads benchmarks for healthcare: Key takeaways
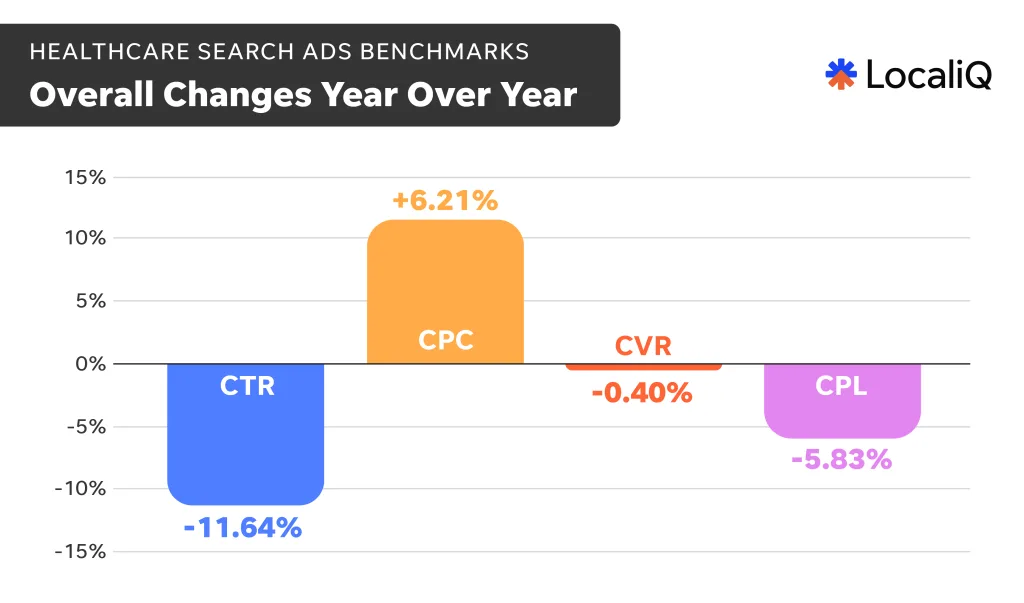
Our healthcare benchmarks are generally in line with what we saw in our overall search ads benchmarks, although cost per lead actually decreased for healthcare search ads while it increased across the majority of industries.
- Average click-through rate (CTR) decreased for 81% of healthcare businesses we looked at, with an overall average decrease of 11.64%. This is a reversal from what we saw in our overall search ads benchmarks, where only 52% of industries saw a decrease in CTR YoY. The subcategories that saw CTR decreases included Emergency Medicine and Hospitals & Clinics, which were more sheltered from economic factors. Subcategories like Orthodontics and Dermatology that saw larger decreases in CTR are elective and could be more impacted by economic uncertainty. Others, like Assisted Living, could have seen increased competition.
- Cost per click (CPC) increased for 56% of healthcare businesses we measured. Some healthcare businesses, like Mental Health, saw fairly substantial increases in CPC (over 42%). Search ads costs are rising across the board, so it’s not surprising to see this reflected for healthcare businesses as well.
- Conversion rate (CVR) decreased for 7 out of 16 healthcare subcategories we looked at, with a fairly stable decrease YoY (-0.40%). This is a departure from what we saw in our overall search ads benchmarks, where there was a 6.84% increase overall YoY. This could be due to a crowded search results page in the healthcare space—many of these results pages include Local Services Ads, regular search ads, Maps ads, and more. Or it could be because healthcare can have a longer sales cycle as potential patients are doing lots of research to find the right provider.
- Cost per lead (CPL) decreased for 63% of healthcare businesses we measured, with an average decrease of 5.83% YoY. This is interesting given CPL has steadily climbed over the last few years and increased 5.13% YoY across all industries. This could be due to more advanced and effective targeting, more tailored ad copy, and a better understanding of what prospective patients are searching for.
Overall, the healthcare industry remained fairly stable despite economic challenges and is one of the few industries experts predict won’t be hugely impacted by economic factors like tariffs.
Healthcare search ads benchmarks by metric
Ready to take a closer look at these healthcare benchmarks by metric and subcategory? Let’s go!
🚨 Did the doctor order your campaigns a prescription for an instant account audit? Use our Free Google Ads Grader to get a full report on how to improve your search strategy ASAP.
Average click-through rate
Click-through rate is the first indication of whether or not your healthcare ads are effective. It evaluates your total number of clicks in comparison to your total number of impressions to show how often searchers are taking action once they see your ads.
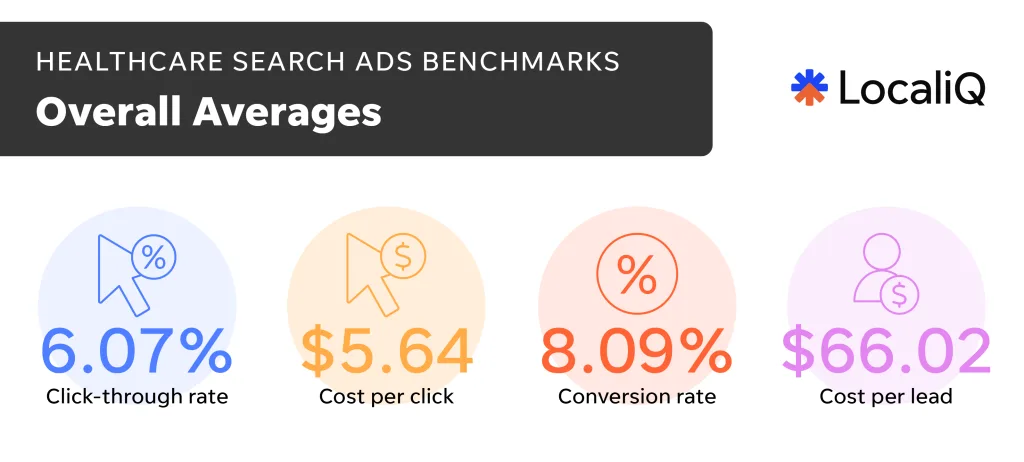
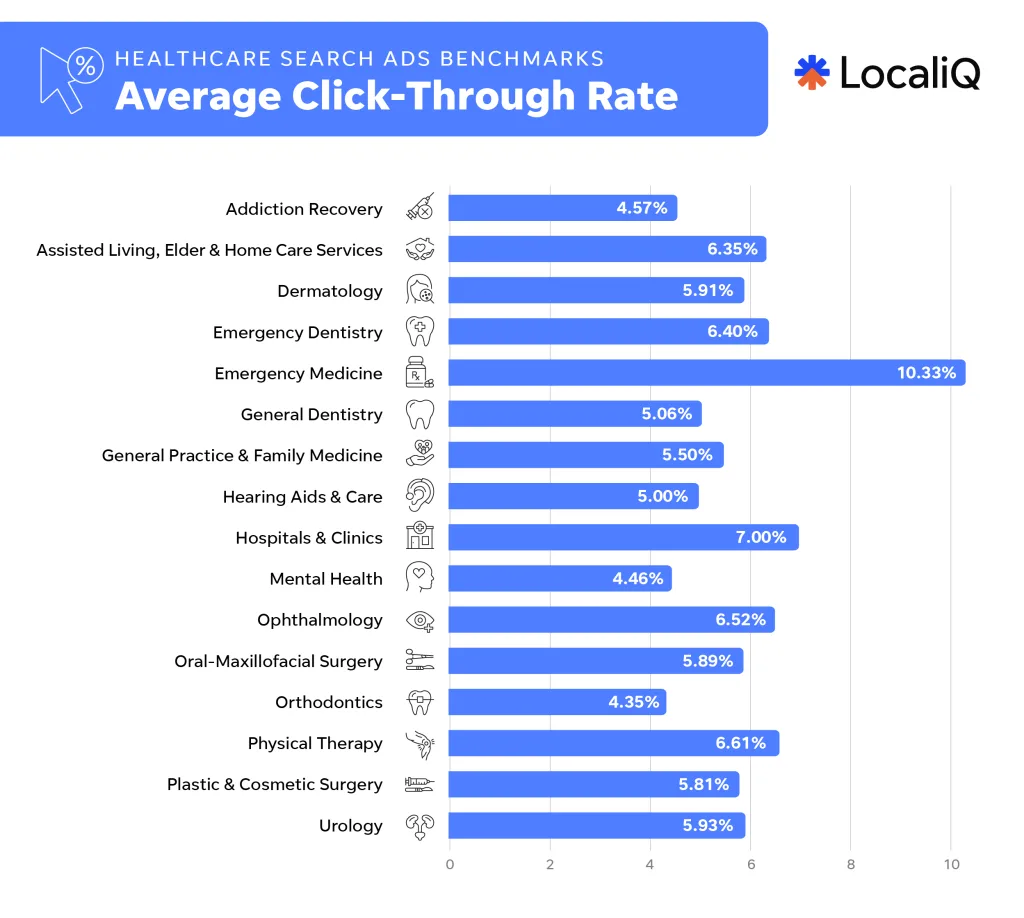
The overall average click-through rate for healthcare search ads this year is 6.07%. This is about a 12% decrease year over year.
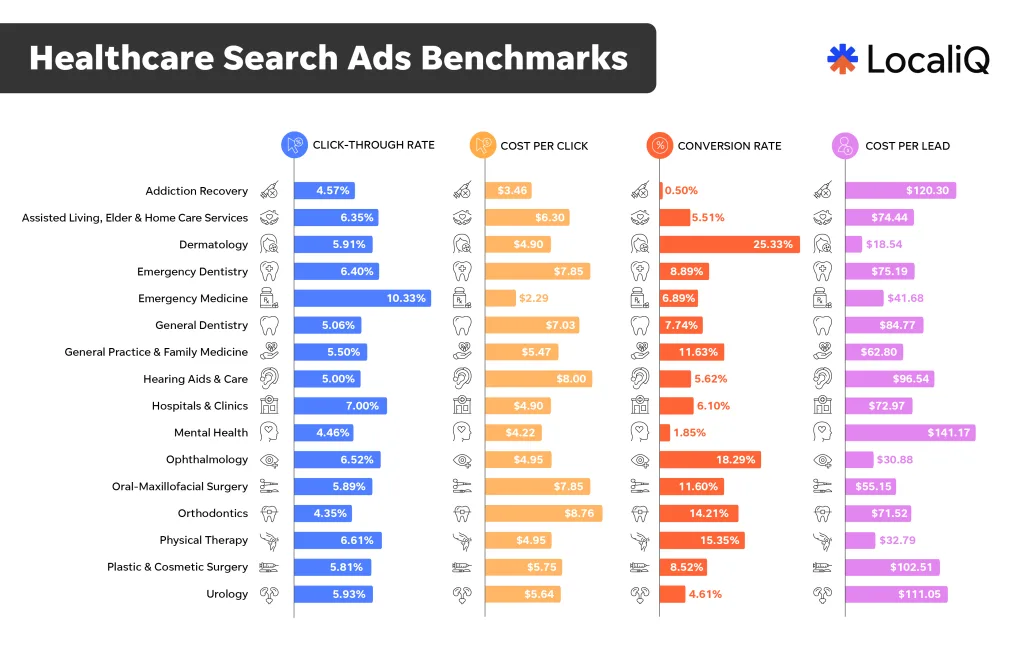
| Healthcare subcategory | Average CTR |
| Addiction Recovery | 4.57% |
| Assisted Living, Elder & Home Care Services | 6.35% |
| Dermatology | 5.91% |
| Emergency Dentistry | 6.40% |
| Emergency Medicine | 10.33% |
| General Dentistry | 5.06% |
| General Practice & Family Medicine | 5.50% |
| Hearing Aids & Care | 5.00% |
| Hospitals & Clinics | 7.00% |
| Mental Health | 4.46% |
| Ophthalmology | 6.52% |
| Oral-Maxillofacial Surgery | 5.89% |
| Orthodontics | 4.35% |
| Physical Therapy | 6.61% |
| Plastic & Cosmetic Surgery | 5.81% |
| Urology | 5.93% |
Emergency Medicine had the highest average CTR this year at 10.33%. The other two highest click-through rate healthcare subcategories were Hospitals & Clinics at 7% and Physical Therapy at 6.61%.
The three healthcare subcategories with the lowest average CTRs this year were Orthodontics (4.35%), Mental Health (4.46%), and Addiction Recovery (4.57%).
Average CTR year over year
The healthcare industries that had the biggest year-over-year drops in CTR performance were Orthodontics and Dermatology (both down 28%), as well as General Practice & Family Medicine (down 21%).
Meanwhile, Emergency Medicine saw the biggest increase in CTR performance year over year, increasing by nearly 10%. This was followed by Hospitals & Clinics with a CTR increase of nearly 2%, and Oral-Maxillofacial Surgery with an increase of about 1% year over year.
Average cost per click
You pay for every click your healthcare ads generate, so while a high click-through rate is ideal for your practice, it can be a double-edged sword if you’re yielding a high average cost per click. The lower your CPC, the more clicks your practice can afford.
The overall average cost per click for healthcare search ads this year is $5.64. This is about a 6% increase year over year.
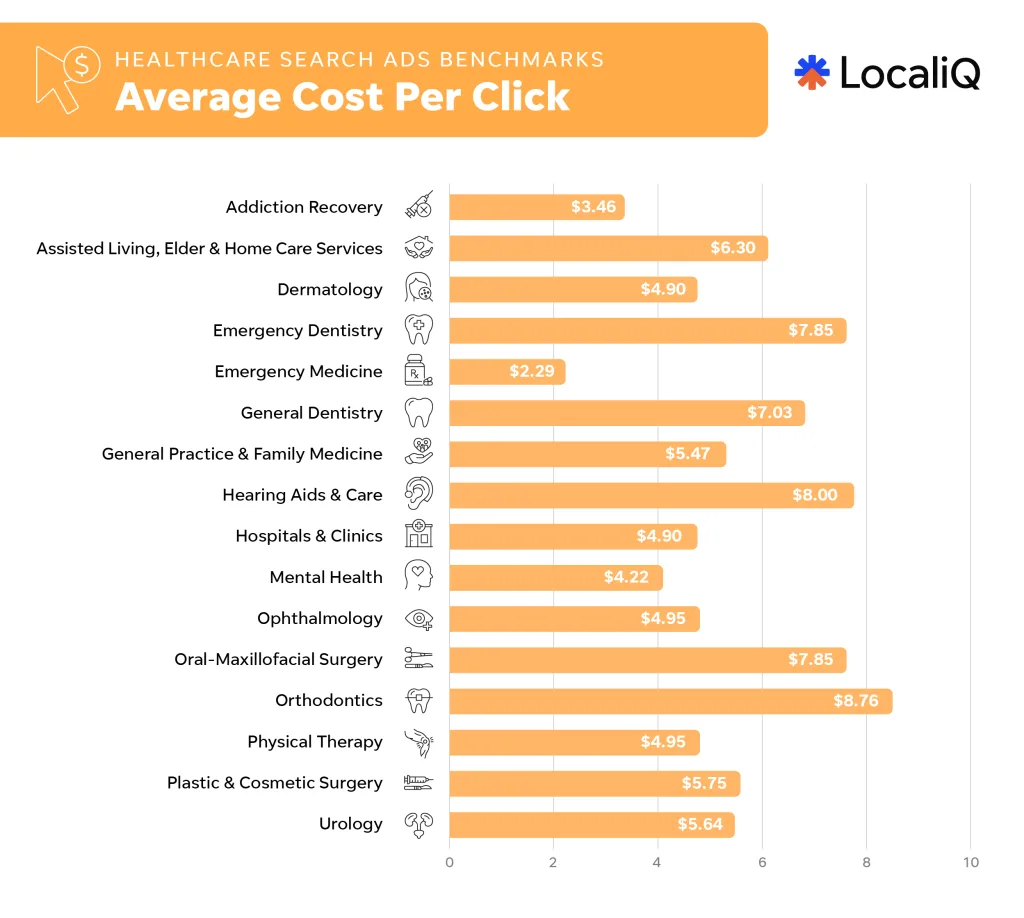
| Healthcare subcategory | Average CPC |
| Addiction Recovery | $3.46 |
| Assisted Living, Elder & Home Care Services | $6.30 |
| Dermatology | $4.90 |
| Emergency Dentistry | $7.85 |
| Emergency Medicine | $2.29 |
| General Dentistry | $7.03 |
| General Practice & Family Medicine | $5.47 |
| Hearing Aids & Care | $8.00 |
| Hospitals & Clinics | $4.90 |
| Mental Health | $4.22 |
| Ophthalmology | $4.95 |
| Oral-Maxillofacial Surgery | $7.85 |
| Orthodontics | $8.76 |
| Physical Therapy | $4.95 |
| Plastic & Cosmetic Surgery | $5.75 |
| Urology | $5.64 |
Industries with the highest average costs per click included Orthodontics at $8.76, Hearing Aids & Care at $8.00, as well as Emergency Dentistry and Oral-Maxillofacial Surgery, both at $7.85.
On the opposite end, the industries with the lowest average CPCs this year were Emergency Medicine at $2.29, Addiction Recovery at $3.46, and Mental Health at $4.22.
Average CPC year over year
The healthcare industry subcategory that had the biggest decrease in average CPC year over year was Hospitals & Clinics, which decreased by 11%. This was followed by Physical Therapy and Plastic & Cosmetic Surgery, both of which had their CPC decrease by about 10% year over year.
In contrast, Mental Health saw the biggest increase in CPC year over year, by 42%. Additionally, Oral-Maxillofacial Surgery and Assisted Living, Elder, & Home Care Services both saw their average CPCs increase year over year by 32%.
Average conversion rate
Average conversion rate tells the complete story of how efficiently your healthcare business is turning ad clicks into potential patients.
The average conversion rate for healthcare search ads is currently 8.09%. This overall average CVR has remained steady year over year.
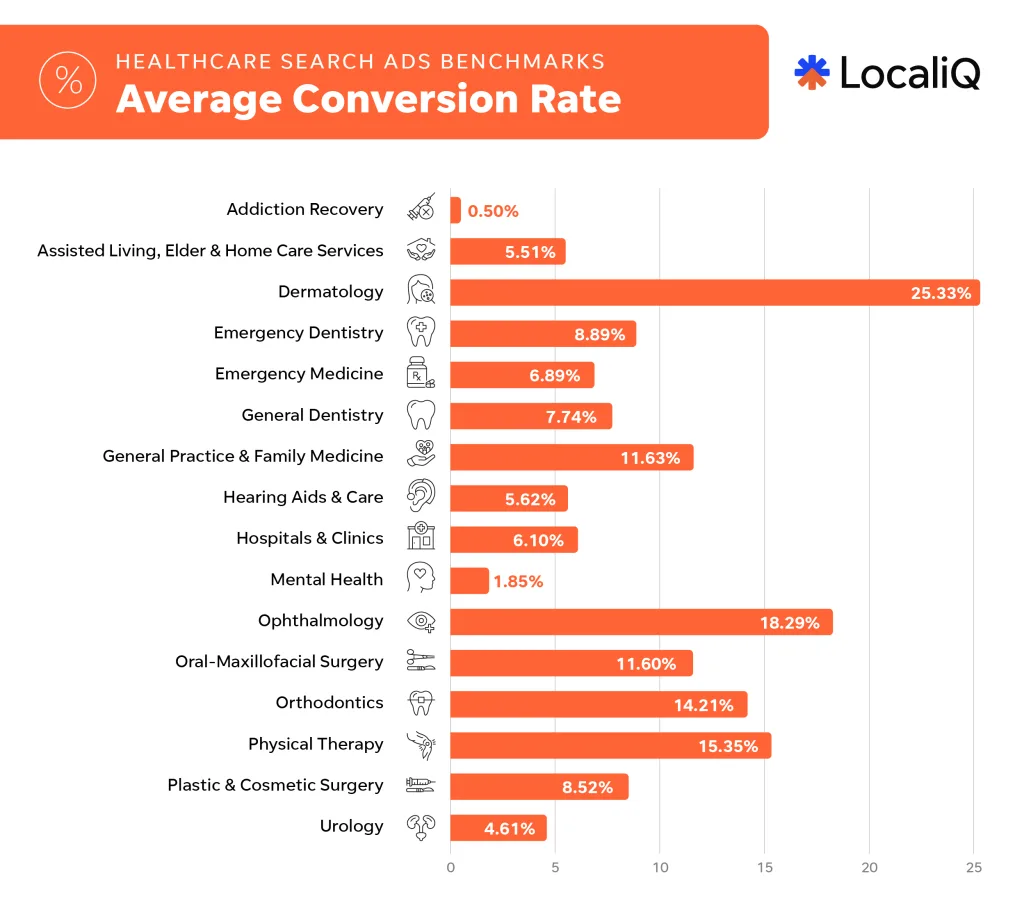
| Healthcare subcategory | Average CVR |
| Addiction Recovery | 0.50% |
| Assisted Living, Elder & Home Care Services | 5.51% |
| Dermatology | 25.33% |
| Emergency Dentistry | 8.89% |
| Emergency Medicine | 6.89% |
| General Dentistry | 7.74% |
| General Practice & Family Medicine | 11.63% |
| Hearing Aids & Care | 5.62% |
| Hospitals & Clinics | 6.10% |
| Mental Health | 1.85% |
| Ophthalmology | 18.29% |
| Oral-Maxillofacial Surgery | 11.60% |
| Orthodontics | 14.21% |
| Physical Therapy | 15.35% |
| Plastic & Cosmetic Surgery | 8.52% |
| Urology | 4.61% |
Dermatology had the highest average CVR this year at 25.33%, followed by Ophthalmology at 18.29% and Physical Therapy at 15.35%.
Meanwhile, the healthcare subcategories with the lowest average CVRs this year were Addiction Recovery (0.50%), Mental Health (1.85%), and Urology (4.61%).
Average CVR year over year
The industries with the biggest improvements in CVR year over year were Dermatology (up 54%), Hearing Aids & Care (up 52%), and Plastic & Cosmetic Surgery (up 38%).
The industries with the biggest declines in CVR year over year were Addiction Recovery (down 87%), Mental Health (down 61%), and Urology (down 35%).
Average cost per lead
Cost per lead is often the “money metric” for many healthcare businesses because it indicates how much budget is required for your practice to acquire new patients from search ads.
The average cost per lead for healthcare search ads is currently $66.02. This is a 6% decrease from last year’s average CPL.

| Healthcare subcategory | Average CPL |
| Addiction Recovery | $120.30 |
| Assisted Living, Elder & Home Care Services | $74.44 |
| Dermatology | $18.54 |
| Emergency Dentistry | $75.19 |
| Emergency Medicine | $41.68 |
| General Dentistry | $84.77 |
| General Practice & Family Medicine | $62.80 |
| Hearing Aids & Care | $96.54 |
| Hospitals & Clinics | $72.97 |
| Mental Health | $141.17 |
| Ophthalmology | $30.88 |
| Oral-Maxillofacial Surgery | $55.15 |
| Orthodontics | $71.52 |
| Physical Therapy | $32.79 |
| Plastic & Cosmetic Surgery | $102.51 |
| Urology | $111.05 |
The three industries that had the lowest average costs per lead this year were Dermatology ($18.54), Ophthalmology ($30.88), and Physical Therapy ($32.79).
Conversely, Mental Health had the highest average cost per lead this year at $141.17, followed by Addiction Recovery at $120.30, and Plastic & Cosmetic Surgery at $102.51.
Average CPL year over year
The industries with the biggest decreases in CPL year over year were Dermatology (down 37%), Emergency Medicine (down 32%) and Plastic & Cosmetic Surgery (down 29%).
The industries with the biggest increases in CPL year over year were Mental Health (up 146%), Hearing Aids & Care (up 107%), and Addiction Recovery (up 77%).
Tips for healthcare practices to improve search ads campaigns
If your specific healthcare vertical is an outlier here, or you find your own search ad results don’t perfectly align with the data above, that doesn’t mean your campaigns are doomed for “code blue” territory.
Remember, every Google Ads and Microsoft Ads account is unique, and what might look like success for your healthcare business’s specific advertising instance could be very different from the competition.
However, there are also solutions within reach to help your search strategy reach its full potential. Check out these healthcare advertising tips.
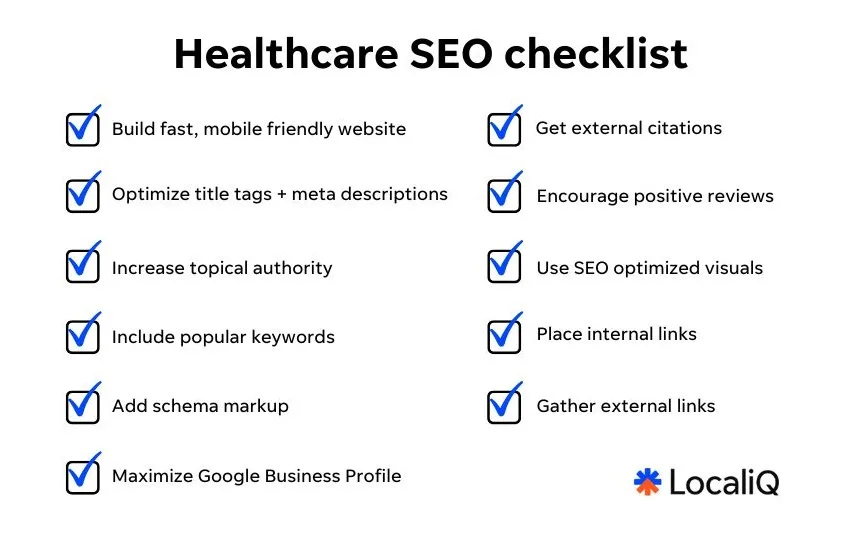
1. Balance your search ad strategy with a strong SEO approach
Focusing on your healthcare SEO can fill in any gaps in your search strategy that your ad budget may not be able to fill. When your healthcare business dominates both paid and organic placements on the search results page, you’re increasing your brand visibility and credibility. To start, this handy SEO checklist specific to healthcare businesses can help.
2. Strengthen your targeting with first-party data
Targeting can be a challenge for healthcare advertisers because of Google’s policies and restrictions on personalized ads that speak to sensitive health conditions. While you can’t build audience segments based on patient health information, you can still collect and use first-party data to segment by patient scheduling patterns or other broader engagement behaviors.
One of the easiest ways to collect first-party data is to start with your existing patient touchpoints. Appointment request forms, newsletter signups, event registrations, and so on, are all examples of actions you can track and leverage in your search ad accounts.
When you integrate this data into your CRM or lead management tool, you can better understand which campaigns and keywords drive high-quality patient inquiries. This also allows automated features, like Smart Bidding, to prioritize your most valuable conversion actions.
💡 See how Smart Bidding can benefit your healthcare campaigns, and learn how to start using it fast, with our fool-proof guide to Smart Bidding!
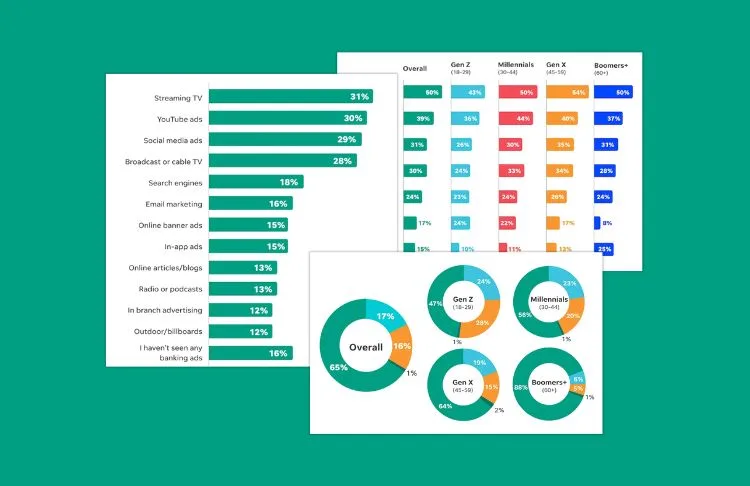
3. Complement your strategy with social ads
Advertising on platforms like Meta Ads, which covers Facebook, Instagram, and more, ensures you’re catching potential patients at every possible touchpoint beyond just the search results page. If you’re already running search ad campaigns, social ads are a no-brainer because you can easily use the same assets across both platforms. For instance, you’re able to easily import your social ad campaigns into Microsoft Ads for a more expansive approach.
Running ads on social media can also benefit your search strategy because it enables your healthcare business to collect even more audience data through additional channels.

An example healthcare ad on social media.
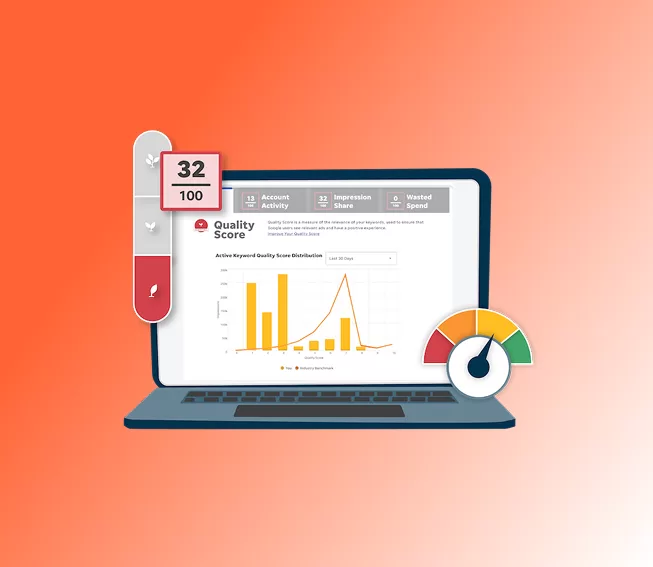
4. Be mindful of your Quality Score
Quality Score plays a key role in keeping costs manageable for healthcare advertisers, especially in subcategories with higher competition like dentistry or specialty care.
Improving Quality Score starts with ensuring that your keyword list is tightly aligned with your ad groups and that your ad copy mirrors the language in popular queries patients are searching for. Additionally, your landing pages should clearly communicate the services your practice offers and make it easy for potential patients to book appointments.
A stronger Quality Score can help lower your CPCs and improve your ad rank, even if you’re practicing a healthcare specialty with rising demand.

Your Quality Score has a direct impact on your search ad performance.
Give your healthcare ads a pulse check
These healthcare search advertising benchmarks make it clear that patients are continuing to turn to Google and Microsoft Bing to find trusted healthcare providers, but competition across specialties continues to intensify.
While this data helps you understand how your campaigns compare, remember, your practice, audience, and goals are unique. The real measure of success is how your results improve over time, and that’s where we can help. Reach out to see how our solutions can strengthen your search advertising strategy and maximize your healthcare practice’s success.
About the data
This report is based on a sample of 3,542 US-based search advertising campaigns running between October 1, 2024, and September 30, 2025. Each subcategory includes at minimum 43 unique active campaigns. “Averages” are technically median figures to account for outliers. All currency values are posted in USD.

Recommended for you


Unlock your business potential
We offer innovative technology and unparalleled expertise to move your business forward.