

It’s no secret that search advertising is one of the most powerful growth levers for businesses in the home services industry. On average, over 55% of consumers run a search before scheduling an appointment with a home services business—and that percentage only grows higher when broken out into specific home service specialties.
You may have seen our complete search ad benchmarks where we looked at 23 industries—including home services. However, home services can include tons of sub-industries within it. So, if you’re looking for a breakdown more specific to your unique home services business, you’re in the right place. We’re sharing the average search advertising benchmarks for various home services, including:
Plus, we’re sharing practical tips home services businesses can use to improve their campaigns and see stellar results from their Google Ads.
Want all our latest benchmark data across industries complete with even more tips? Download >> 2023 Search Advertising Benchmarks for Every Industry
Average click-through rate for home services search advertising
Click-through rate (CTR) is a crucial metric for home services businesses since it determines how frequently your ad is being clicked on—as opposed to only gaining impressions. Getting a user to click on your Google or Microsoft Ad is half the battle when it comes to converting website visitors into customers.
The average click-through rate for home services search ads in 2023 is 4.80%.
| Home services business type | Avg. click-through rate |
| Air Conditioning Installation & Repair | 3.40% |
| Air Conditioning Sales | 3.42% |
| Construction & Contractors (General) | 6.25% |
| Heating & Furnaces | 3.47% |
| Landscaping | 5.20% |
| Pest & Rodent Control | 5.54% |
| Plumbing | 3.34% |
| Pools & Spas | 5.32% |
| Roofing & Gutters | 3.85% |
We found that Construction & Contractors had the highest average click-through rate at 6.25%, followed by Pest & Rodent Control at 5.54% and Landscaping at 5.20%.
In contrast, Plumbing businesses had the lowest average click-through rate at 3.34%, along with Air Conditioning Installation and Repair at 3.40% and Air Conditioning Sales at 3.42%.
Overall, click-through rate increased on average by 3.45% year over year across the entire home services category. This is part of the main trend we saw with 21 out of 23 industries seeing an increase in click-through rate.
Average cost per click for home services search advertising
Average cost per click (CPC) is a metric that directly speaks to your business’s bottom line since it divides your total spend by your total number of clicks to understand how much an individual click will cost you. A high cost per click tends to also lead to a high cost per lead, since you first must pay for a click to convert a user into a lead.
The average cost per click for home services search ads in 2023 is $6.55.
| Home services business type | Avg. cost per click |
| Air Conditioning Installation & Repair | $9.49 |
| Air Conditioning Sales | $7.69 |
| Construction & Contractors (General) | $3.60 |
| Heating & Furnaces | $8.50 |
| Landscaping | $5.47 |
| Pest & Rodent Control | $9.39 |
| Plumbing | $9.39 |
| Pools & Spas | $3.60 |
| Roofing & Gutters | $11.13 |
Pools & Spas as well as Construction & Contractors both had the lowest average cost per click at $3.60. Landscaping had the third-lowest average cost per click on our list at $5.47.
The home services businesses with the highest average cost per click are Roofing & Gutters ($11.13), Air Conditioning Installation & Repair ($9.49), and Rodent Control and Plumbing ($9.39).
Overall, these costs trend a little higher than the average cost per click across all 23 industries of $4.22. However, many factors, like inflation and supply chain issues, have contributed to increased costs across the board, and 61% of industries saw an increase in cost per click year over year.
Average conversion rate for home services search advertising
Average conversion rate (CVR) is calculated by dividing your total number of clicks by your total number of conversions (also known as leads). Of course, this metric is critical to your business growth from search ads since a higher conversion rate equates to more jobs getting booked for your home services business.
The average conversion rate for home services search ads in 2023 is 10.22%.
| Home services business type | Avg. conversion rate |
| Air Conditioning Installation & Repair | 13.87% |
| Air Conditioning Sales | 15.11% |
| Construction & Contractors (General) | 3.65% |
| Heating & Furnaces | 13.55% |
| Landscaping | 11.97% |
| Pest & Rodent Control | 15.52% |
| Plumbing | 15.61% |
| Pools & Spas | 11.81% |
| Roofing & Gutters | 5.58% |
The home services businesses with the highest conversion rates were Plumbing (15.61%), Pest & Rodent Control (15.52%), and Air Conditioning Sales (15.11%).
Meanwhile, Construction & Contractors had the lowest conversion rate (3.65%), along with Roofing & Gutters (5.58%), and Pools & Spas (11.81%).
The average conversion rate across all industries was 7.04%, so these home services conversion rates average out a bit higher compared to other industries. That said, 91% of industries saw a decrease in conversion rates year over year—including home services.
Average cost per lead for home services search advertising
Average cost per lead (CPL) is fondly known as the “money metric” in PPC since it’s so meaningful to your business’s marketing ROI. It’s calculated by dividing your total spend by your total number of leads or conversions. A lower cost per lead means more bang for your buck!
The average cost per lead for home services search ads in 2023 is $66.02.
| Home services business type | Avg. cost per lead |
| Air Conditioning Installation & Repair | $89.12 |
| Air Conditioning Sales | $74.44 |
| Construction & Contractors (General) | $93.69 |
| Heating & Furnaces | $92.76 |
| Landscaping | $64.72 |
| Pest & Rodent Control | $45.60 |
| Plumbing | $72.97 |
| Pools & Spas | $29.08 |
| Roofing & Gutters | $186.79 |
Some home services had lower-end average costs per lead, like Pools & Spas ($29.08), Pest & Rodent Control ($45.60), and Landscaping ($64.72).
On the other hand, Roofing & Gutters had the highest average cost per lead ($186.79) for the home services businesses we analyzed. Construction & Contractors had the second highest average cost per lead (93.69) and Heating & Furnaces took the third-highest average cost per lead spot ($92.76).
Cost per lead increased for 91% of industries with home services being one of them. The average cost per lead across all industries is $53.52.
5 tips for home services search advertising
If you feel like your home services business’s search ads results don’t quite align with the industry averages above, that’s okay! There are plenty of ways to improve your Google Ads strategy. Try these home services advertising tips below:
1. Leverage ad assets
Ad assets (formerly known as ad extensions) are additional features, like extra images, text, or links, that are added to your ads in real time on the search engine results page (SERP). They help you stand out and can provide additional context to your ad viewers.
For home services businesses, ad assets can be especially beneficial since they convey additional concepts that your regular text ads may not be able to. For example, you could upload image assets to showcase past jobs or include a link to a customer testimonial page on your website.

2. Try Local Services Ads
As you can probably assume from the name, Google Local Services Ads (LSAs) are designed with industries like home services in mind. These ads show above regular ads on the SERP and pull information from your
The beauty of LSAs is that they are pay per lead instead of pay per click. This makes them the ideal solution for a home services business to looking to drive leads since you’d only pay when someone contacts your business.

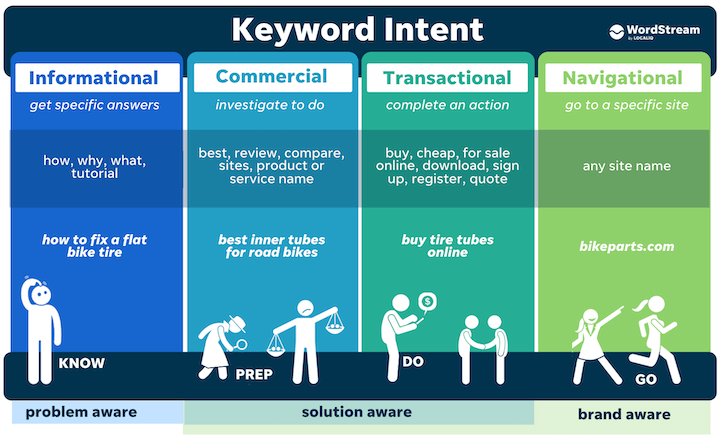
3. Consider search intent
You may have noticed above that some of the sub-industries that yielded a higher click-through rate but lower conversion rate were ones that tend to have a longer sales cycle. Construction & Contractors, for example, had the highest click-through rate but the lowest conversion rate.
These types of businesses tend to offer larger packages to customers, so prospective buyers are likely to take more time to consider before they convert. In this case, you may need to adjust your PPC keywords to attract a more bottom-of-funnel audience. That way, you don’t pay for clicks from someone just looking for information. Focusing on transactional search intent, versus informational, can make all the difference if you’re seeing a high CTR but a low CVR.
4. Keep your budget (and strategy) flexible
A common small business challenge is knowing how much marketing budget to put behind a given strategy. Unfortunately, the only way to know for sure is to collect data on your marketing ROI as you execute your search ads. While you can use Microsoft and Google Ad industry benchmarks to estimate your ad costs, you may find that your unique account needs more or less budget than average.
The best way to handle this is to be flexible with your campaign budgets and test out a few different search campaign structures. It can be easy to get hung up on one specific search campaign strategy. However, diversifying your account with a few different campaigns will give you wiggle room to flex budgets to where you're getting the highest return.
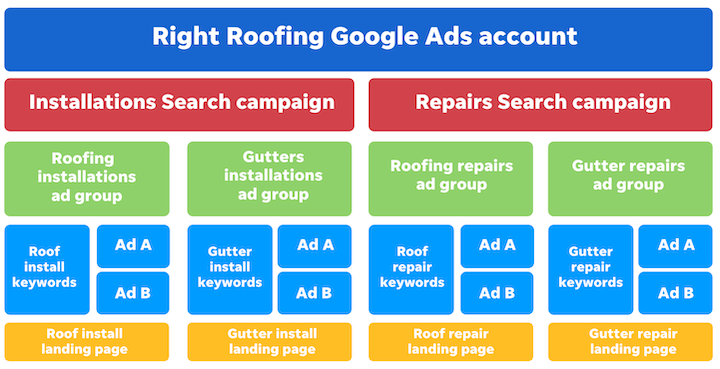
Multiple search campaigns, like we see in this example, would promote different offerings that may have varying budget needs.
5. Try other campaign types
It's no secret that the buyer's journey is rapidly changing. For instance, we're seeing emerging AI technology from Google as well as the rise in device usage across households. There are endless opportunities for your home services business to promote your business beyond your standard text ad.
Be open to trying additional campaign types to supplement your search results, like Performance Max, Video, or Display. For example, consumers are 155% more likely to look up brand-specific terms after they’ve seen a display ad, and their likelihood of converting from a search after seeing a display ad is 59%. Try to have a holistic, cross-channel marketing approach to your Google and Microsoft Ads strategies for maximized success.
Get your home services search advertising above the industry average
Since every business is unique, you might find that your results vary from these benchmarks. However, you can use this data to help you get a baseline for how your campaigns should be performing and find out which metrics you may need to optimize.
If you want more insight into how search ads can work for your home services business, reach out to get a demo!
About the data
This report is based on a sample of 2,564 US-based search advertising campaigns running between Apr 1, 2022, and March 31, 2023. Each subcategory includes at minimum 103 unique active campaigns. “Averages” are technically median figures to account for outliers. All currency values are posted in USD.
Related Articles
-

The 12 Most Effective Home Services Promotion Ideas
-

40 Best Real Estate Call-to-Action Phrases to Convert Buyers, Renters, or Sellers
-
12 Super Effective Ways to Get More House Cleaning Leads
-

7 Top Healthcare Marketing Trends for 2024
-

11 Strategies to Generate Healthcare Leads in 2024 (+Examples to Guide You)