There are two types of people in the world: the lucky ones who are savvy with numbers, and the ones who just don’t “get” math (let’s face it: the majority of us are the latter). And while those of us who don’t love math may dream of a world without spreadsheets, data sets, and fractions, the reality would be a mess: pies with sunken crusts, ill-fitting clothes—the list could go on!
Marketing is both a science and an art, meaning some form of measurement is not only involved—it’s required. Without measuring and tracking the right marketing metrics, your strategy would flop just like a soufflé if you didn’t follow the recipe measurements to perfection. The more comfortable you become with your reporting, the better off your business will be!
The term “marketing metrics” can sound scary at first, but we’ll be giving you the tools you need to tackle them like a pro by answering questions like:
- What are marketing metrics?
- Why are marketing metrics important?
- What are some examples of key marketing metrics?
Marketing metrics table of contents
We’re even going to help you narrow down your marketing metric choices by strategy, (click to jump to your desired strategy, or keep reading to get ALL the info!):
- Marketing metrics for growing businesses
- Content marketing metrics
- Email marketing metrics
- Digital marketing metrics
- Social media marketing metrics
- Website metrics
What are marketing metrics?
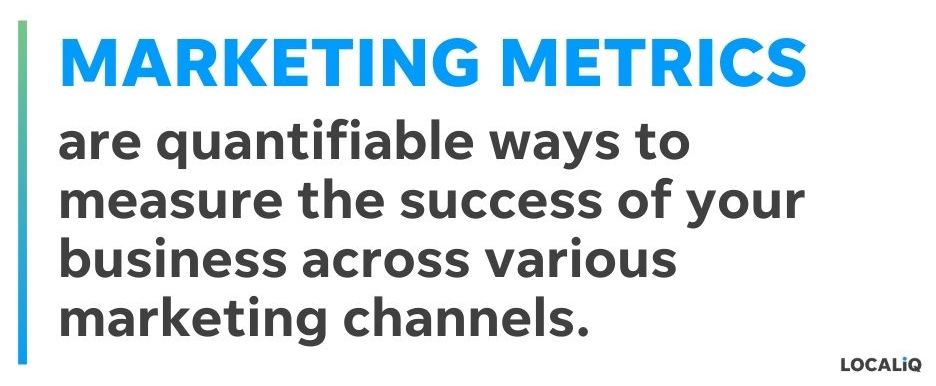
For all the math-haters out there, you’ll be comforted to know that marketing metrics aren’t as intimidating as they may sound. They are simply quantifiable ways to measure the success of your business across various marketing channels.
When you want to track the efficacy of your campaigns and make data-backed decisions on how to appeal to your audience, you use marketing metrics!
Why are marketing metrics important?
Aside from tracking your success, why should you pay attention to marketing metrics? Check out these stats that drive home the importance of reporting on specific marketing metrics:
- Over 75% of businesses are already using marketing metrics to report on how their campaigns are directly influencing revenue.
- 44% of businesses say that “better ROI measurement” was their top priority for 2021.
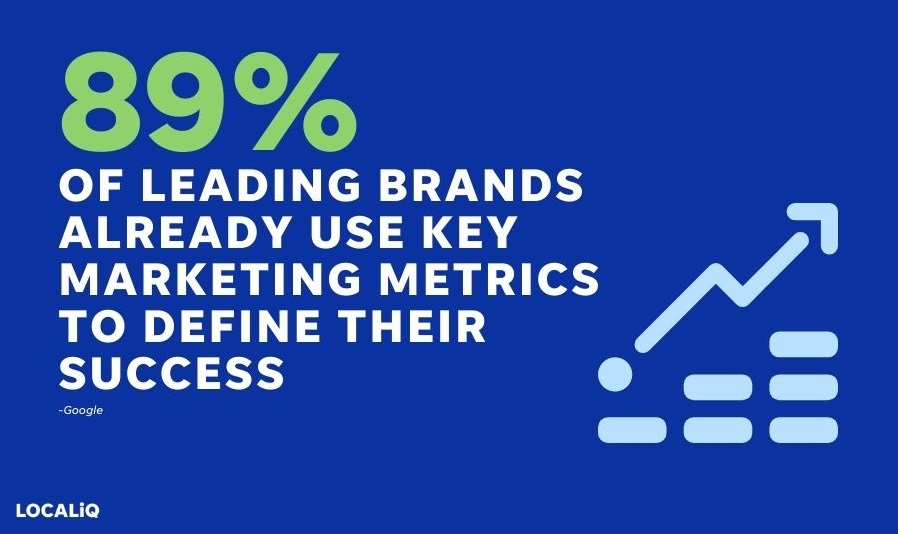
- 89% of leading brands use strategic marketing metrics like ROI and more to define the effectiveness of their efforts.
- 50% of B2B businesses cite the inability to measure marketing metrics a major challenge.
- 49% of businesses are only using basic metrics and aren’t yet taking advantage of key marketing metrics.
Not only does this data prove that marketing metrics are something you won’t want to miss out on, but it also highlights how leveraging marketing metrics can help your business stand out from the competition.
Key marketing metrics for growing businesses in any industry
Whether you’re a franchise business, a family-owned local shop, a small online startup, or any business in between, these marketing metrics are applicable across your multichannel marketing strategy:
Impressions
Impressions are the number of times a piece of your marketing is displayed in someone’s view. Impressions get counted regardless of whether your ad, post, or any other type of content gets interacted with.
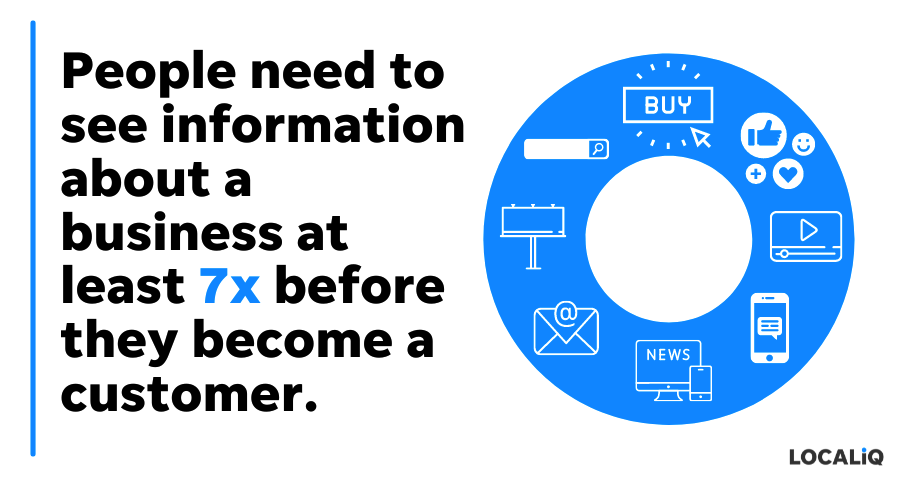
The more impressions you have, the more eyeballs you’re getting on your business’s ads, website results, or social media posts—whether viewers act on it or not. Impressions get too often overlooked since they don’t always correlate to someone becoming a customer, but this marketing metric is vital for your brand awareness—especially because people need to see information at least seven times before recalling it.
Clicks
Clicks are a pretty self-explanatory marketing metric. Clicks measure the number of times someone has clicked on your ad, listing, search results, etc.
Clicks are the next step in your buyer’s journey after an impression is made because you want your target user to take the next step to learn more about your business from your marketing or advertising.
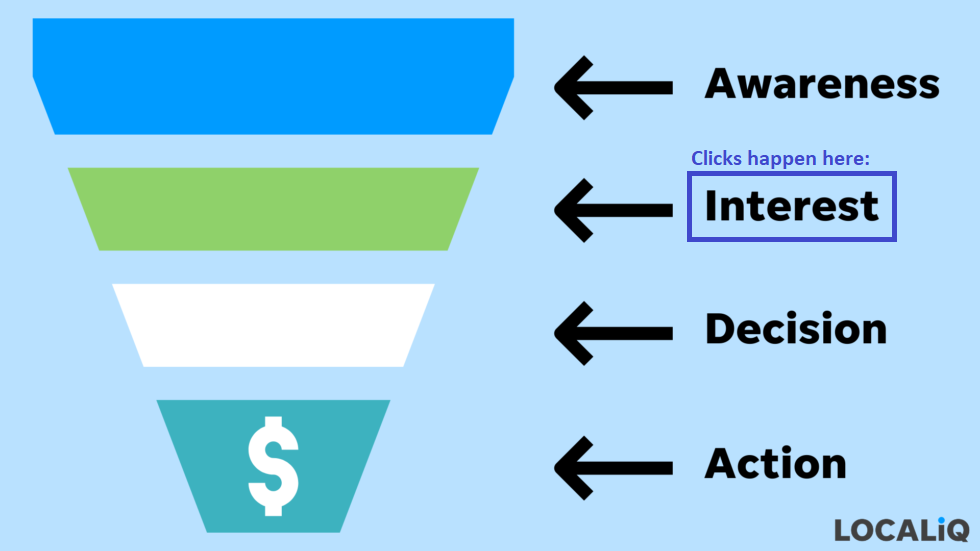
Clicks are half the battle when it comes to moving a customer down the funnel towards our next metric, conversions!
(Get a deep-dive into the differences between impressions vs. clicks here.)
Conversions
Once you get a user to click on promotional assets like social posts, organic results, display ads, and more, it’ll finally be time to get them to complete your desired action (a.k.a. a conversion).
A conversion is when the recipient of a marketing message fully performs an action. The term is derived from the idea that a potential customer would see a specific call to action and “convert” to be a paying customer. That being said, conversions could also be possible for returning customers or happen prior to a sale as a prospect moves down your marketing funnel.
Conversions will look different for every business. However, some examples could include money-making actions for your business like making a purchase, filling out a form, booking an appointment, signing up for a trial, calling your store or office, live chat conversations, and more.

An example of various places conversions could be tracked on a small business’s website.
Get more conversion metrics to track here.
Conversion rate
Conversion rate starts to pull all your metrics together to paint a picture of your business growth. Conversion rate is calculated using your number of conversions and dividing that by your number of clicks.
With a conversion rate percentage, you’re understanding how many clicks to your business’s page are resulting in that money-making conversion. That’s why it’s no secret that tracking this marketing metric is vital to your overall success.
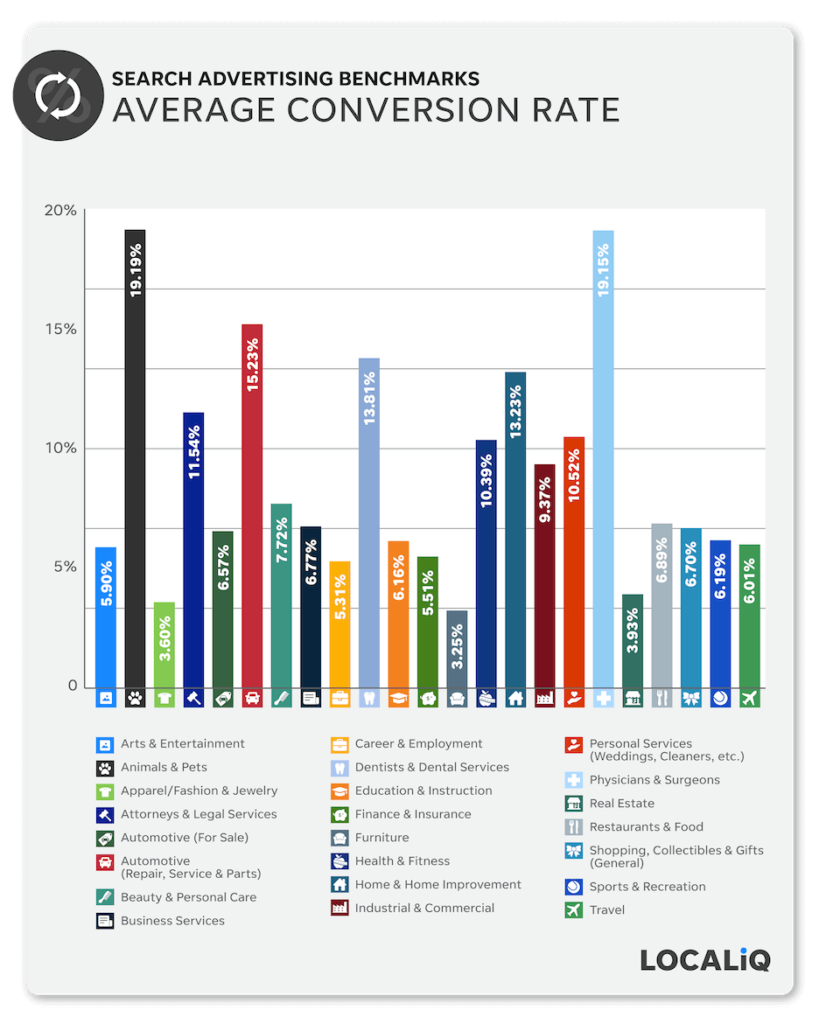
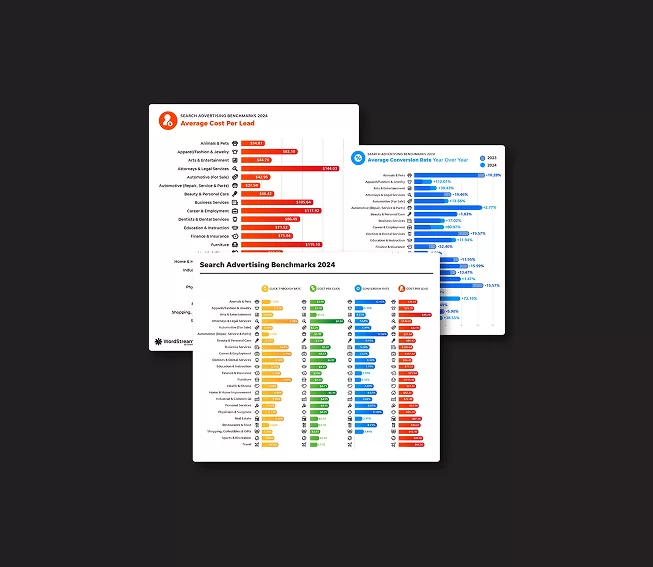
You can see what a good conversion rate for search ads might look like for you using industry resources like our search advertising benchmarks.
ROI
Finally, your marketing ROI pulls all your metrics together as it measures your return on investment.
Marketing ROI is a calculation of how much you spent on marketing in relation to how much revenue is generated in return. Like the metrics above, ROI could look for different for each business out there.
This helpful image below can help you calculate your marketing ROI in a flash:
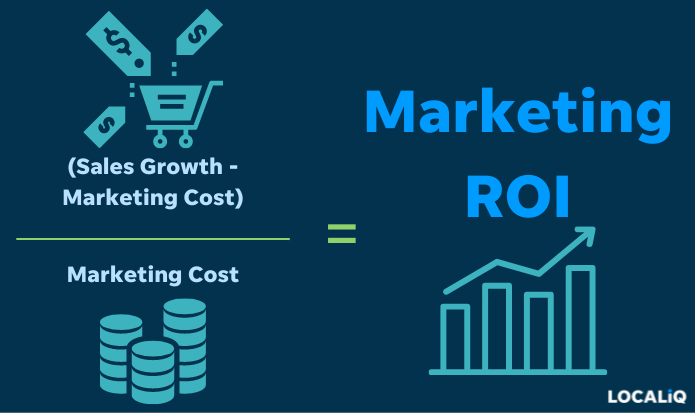
Marketing ROI solely measures your results in terms of how much you spent and what the outcome of that spend was. But it’s also important to consider other investment factors, such as your time, when you consider your overall marketing success.
Marketing metrics for five core strategies
While the metrics we looked at above can apply to just about any marketing plan, there are strategies that will require reporting that’s more specific. Here are five core small business strategies and the marketing metrics that go with them:
1. Content marketing metrics
Content marketing is a valuable strategy that can help you drive more traffic to your website, position your business as an expert, and boost your SEO.
Executing content marketing is one thing but measuring the efficacy of blogs and other content pieces can be double the challenge. Here are some content marketing metrics to look out for (that you can find in Google Analytics):
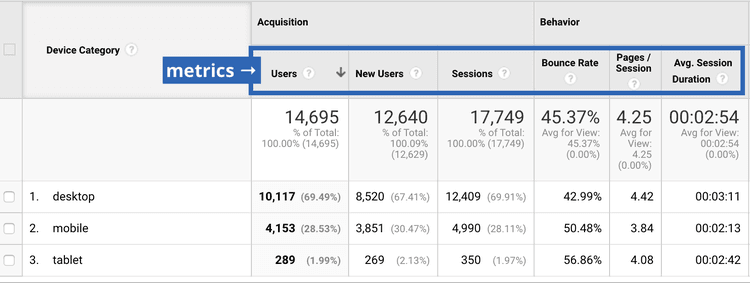
An example of some important content marketing metrics in Google Analytics.
Sessions
You’re not creating content just for fun. You want people to see it! Sessions help you understand if you’re doing that by telling you how many people have interacted with pages on your website for a certain amount of time.
For example, a Google Analytics session begins when a user visits a page on your site and ends after 30 minutes of inactivity, or when the user leaves. The more sessions you have, the more people are interested in what your blog posts, articles, or web pages have to offer.
Pages/session
Now, we know a session defines how many users are engaging with your website within a certain timeframe. Pages per session (frequently shown as simply pages/session) takes measuring that engagement a step further by defining the average number of pages a visitor has navigated to within that specific timeframe.
This can help you understand if your audience is jumping around to learn more, or really focused on one piece of content. (Or worse, reading one piece of content and leaving!)
Average session duration
While a Google Analytics session would time out after 30 minutes of inactivity, odds are that most of your visitors are leaving your site sooner than that. Average session duration measures this by tracking about how long the typical user spends engaging with pages across your website.
Studies have shown that a reasonable average session duration benchmark to shoot for is between two to three minutes. If you find you need to improve your average session duration, be sure to create interesting content like blogs, free tools, or videos on your pages to drive up your average session duration.
Exit rate
One thing you can do when measuring your entire content marketing approach is to break it down by URL to pinpoint specific pages of low or high performance. When you do so, exit rate is a content marketing metric that comes into play.
Exit rate tells you the percentage of users who visit a website URL and then leave—regardless of whether it was the first or final page they visited. This means any URL within your domain that has an unusually high exit rate probably needs some TLC.
2. Email marketing metrics
While you’re pumping out highly valuable yet measurable content on your blog or website, you’ll most likely be distributing that material via email marketing. Here are your core email marketing kpis to stay on top of your results:
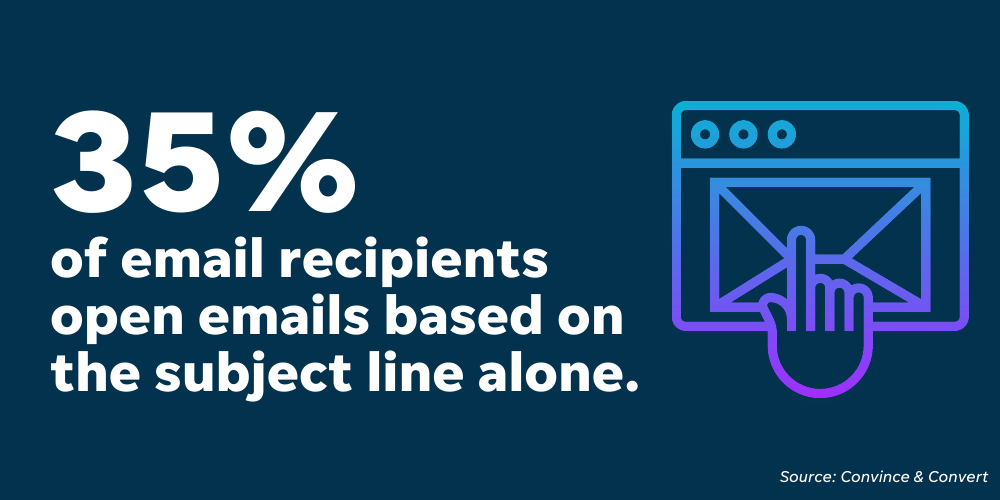
Open rate
Open rate simply tells you how many recipients clicked the email subject line to read your message.
If you don’t measure this marketing metric, you’ll never know if your emails are sitting in inboxes unread, getting pushed to spam, or even being deleted before they get opened.
Since 35% of recipients decide to open emails based on subject lines alone, work on your email subject lines to maintain a tip-top open rate.
Click-through rate (CTR)
Click-through rate (CTR) tracks how many recipients clicked a link inside of your email message. This marketing metric looks beyond open rates to tell you how many people are reading your emails and clicking towards an action.
For example, if you include a button to make a purchase or ask for a referral inside your email, any clicks on that will count towards your email’s CTR. Shown as a percentage, email CTR is calculated by dividing the number of link clicks by the number of opened emails.
Unsubscribe rate
While we wish reporting on email marketing metrics could always bring you “happy thoughts,” the reality is that paying attention to the not-so-fun data is just as important. Unsubscribe rate is the percentage of recipients that opt-out of your email list after opening any given email.
This email marketing metric is, unfortunately, inevitable. However, knowing what your current unsubscribe rate is can help you pinpoint ways to improve on areas like email copywriting, and it allows you to stay on track with your growth goals.

Clicking to share this business’s email could also contribute to their share/forward rate (more on that metric below), whereas clicking unsubscribe will impact their unsubscribe rate.
List growth rate
List growth rate is important for understanding your email marketing success in the long term since it tracks the rate at which your email list is growing. Here’s an example of how to calculate list growth rate:
(20 new subscribers – 5 unsubscribed = 15) ÷ (total number of email addresses in your list, let’s say 50) x 100 = 30% growth rate
List growth rate expires by about 22% each year, so you’ll need to stay on top of this email marketing metric.
Share/forward rate
Strong email content is good, but shared email content is even better. Be sure to keep in mind this email marketing metric when you want to understand how your emails may be getting passed around.
A share or forward rate tracks how many recipients have clicked to share your email content to social media or forward it to a friend.
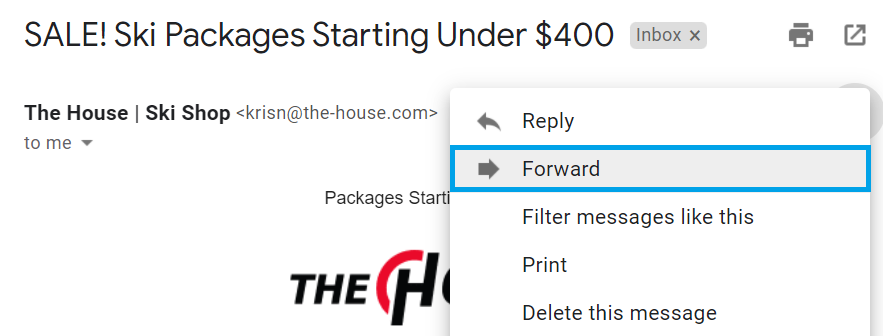
Forwarding this business’s email would contribute to their share/forward rate.
3. Digital advertising metrics
Digital advertising metrics can help you track the success of paid online efforts like local PPC ads, display ads, shopping ads, and more. Before you allocate budget towards those tactics, be sure to check out these paid advertising metrics:
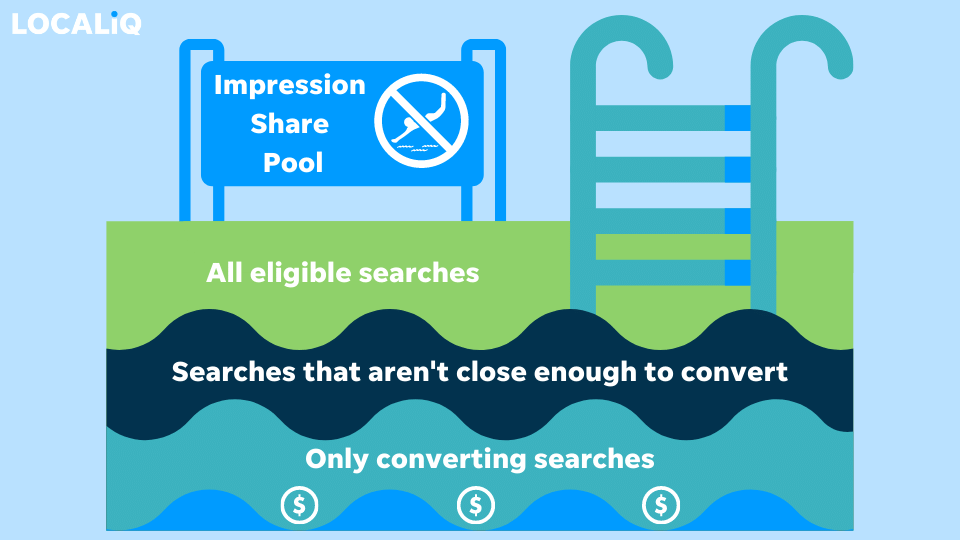
Impression share
Impression share is related to the general impression metric we mentioned above, but with a competitive edge. With impression share, you’re basically answering the question “out of all the times your ad could be showing, how much is it actually showing up?”
Since keywords, competition, targeting parameters, and other factors vary, there is no right or wrong answer as to what your Impression Share percentage should be. That being said, the more you show the better!
To improve on this marketing metric, think of impression share as a swimming pool you’re about to dive into. Your PPC structure contributes to how large or small your impression share pool is. The larger that pool, the more effort it will take to swim a full lap.
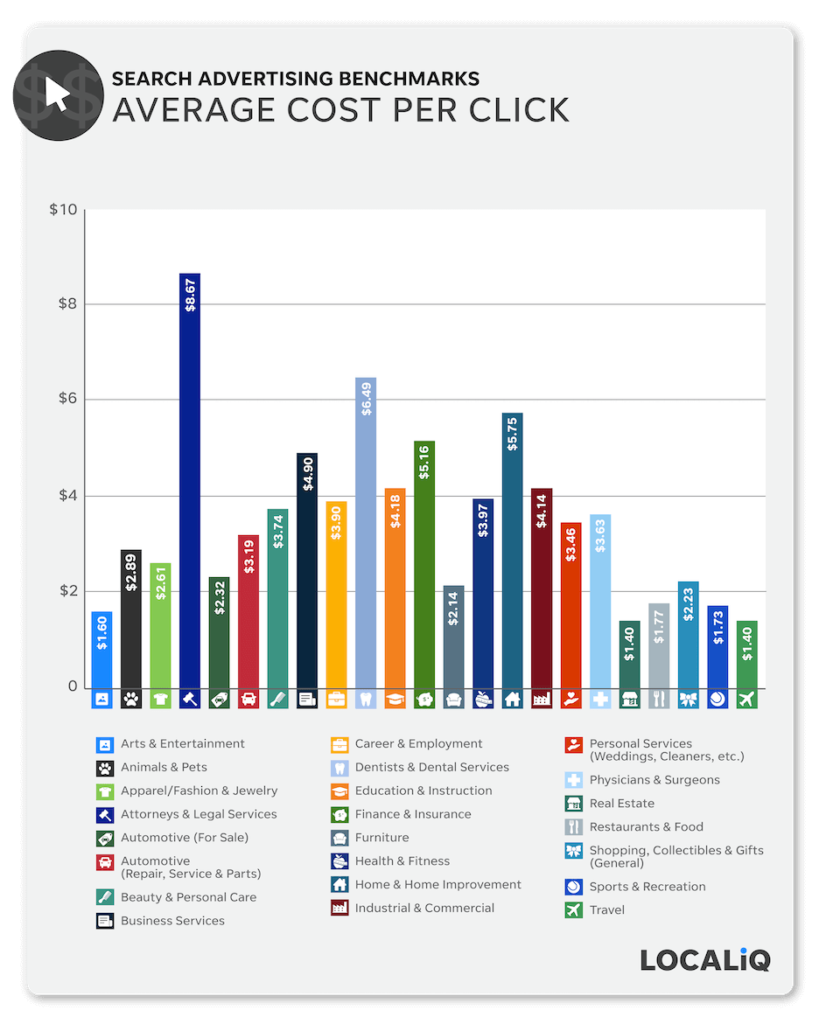
Average cost per click (CPC)
PPC stands for pay-per-click advertising. So, you already know you’ll be paying for each click that happens as a result of your ads.
There are a ton of factors that play into your average cost per click (CPC), and you can’t always control how much you pay because of aspects like competition driving up costs. However, keeping an eye on this marketing metric will help you understand how much you’re spending for each click on average and can open doors for optimization opportunities.
Keep your average CPCs on track by comparing them to industry insights, like our search advertising benchmarks!
Cost per acquisition (CPA)
Cost per acquisition is basically “cost per conversion” but CPC was already taken (see cost per click above). You may have also seen this PPC metric be called cost per action or cost per lead, but CPA is simply a term that breaks down how much it costs you to get your ads to bring you a completed conversion action. CPA is calculated by dividing your overall spend by your total number of conversions.
If your CPA is high, don’t fret. Focusing on driving leads first to offset your overall cost will bring your CPA down in the long run.
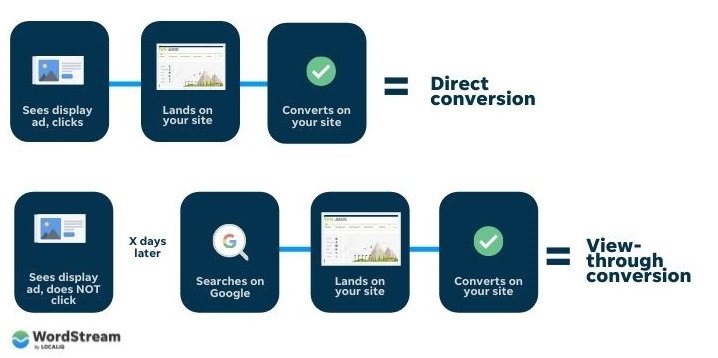
View-through conversions
A marketing metric you shouldn’t ignore in 2022 is view-through conversions, which finally squash the myth that display or video ad success isn’t measurable. View-through conversions track how many conversions may have inadvertently come from your initial display or video ad campaigns.
Have you ever seen an ad, not clicked on it, but eventually went on to click and convert elsewhere later? That’s a view-through conversion in action.
Return on Ad Spend (ROAS)
Return on Ad Spend is a major metric for shopping campaigns, but other campaign types can find this data helpful as well. ROAS tracks the overall revenue your ads are bringing in by looking at the value behind each action a user makes. It takes that revenue number and puts it up against your spending.
This is useful because, while a $12 t-shirt purchase is less than a $50 jeans purchase, they’d both be counted as individual conversions with no context. However, ROAS differentiates the value between those two conversions.
Shown as a ratio or a percentage, a healthy ROAS can vary from account to account. However, the usual starting point for an ideal ROAS is most commonly about 250-350%.
ROAS can be finicky. To start optimizing your ROAS check out this post on how to improve ROAS.
4. Social media marketing metrics
Like some of the marketing strategies mentioned above, social media marketing also falsely gets a bad rap for not being trackable. However, there are ton of social media metrics that can help you find success across platforms:
Engagement
Social media experts often think of engagement as an umbrella term because it wraps up all your likes, comments, shares, or clicks on your posts or social ads into one easy metric. When you tweak your posts to drive more engagement, you’re helping to elevate your brand and continue to rank in News Feeds later.

An example of various engagements on a small business Facebook post.
Reach
Reach, we owe you an apology. Between impressions and engagements, reach often gets left in the dust. However, this social media marketing metric is key to understanding how big of a “net” you’re casting across platforms.
Reach measures how many people have seen a post since it first went live. Reach is unique because it counts heads, rather than counting the same person seeing your post twice. This helps you understand how many unique individuals have seen your social media content at least once.
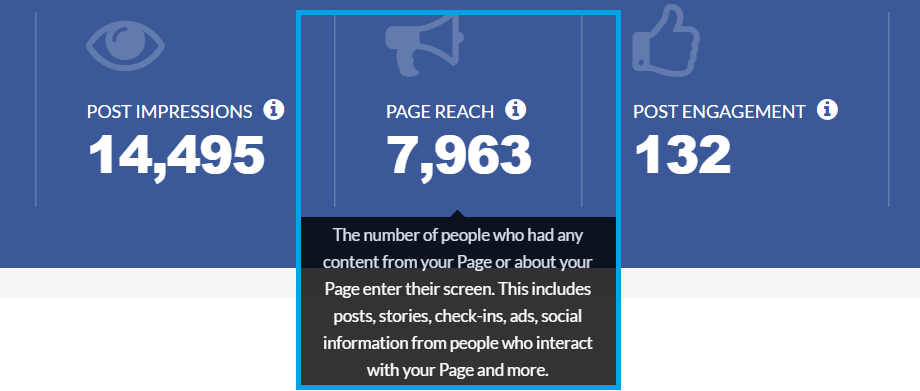
An example of a report that discusses reach.
Frequency
For paid social ads, it’s a given that some people are going to see your ad more than once. With that, comes ad fatigue. Frequency helps you avoid this by calculating the average number of times someone sees your social media asset.
Depending on your targeting parameters, the frequency can get high quickly. A good baseline is to refresh your ad once you hit a frequency of 5-10. With more unique paid social strategies, like remarketing, you may want to wait until your frequency gets up to 10-14.
While frequency is a concrete social media marketing metric commonly shown in paid social advertising dashboards, the concept behind this metric is still applicable in organic social situations. The main takeaway with this metric is that you want to be reevaluating your social content regularly to avoid tiring out your audience.
Brand mentions
Brand mentions help you maintain brand consistency without lifting a finger as people across social media shout you out. Any time someone references your business, or anything associated with your brand online, you get a brand mention feather in your cap.
Brand mentions on social media are at the core of an organic social media marketing strategy. Since this social media marketing metric shows how often your brand is shared or discussed on various platforms, it helps boost your “clout.” That way, you can grow your following and get more out of your free, organic posts.
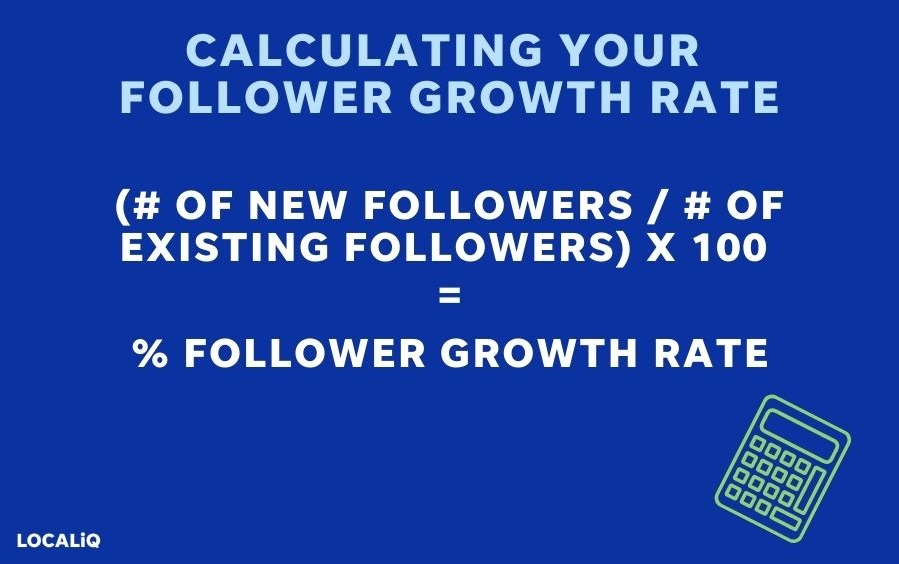
Follower growth rate
With more social media marketing comes more followers! Be sure you’re maintaining that growth by tracking your follower growth rate. This social media marketing metric measures how fast you’re gaining (or losing) followers in relation to your current follower count.
Save this handy image below to calculate your follower growth rate regularly to stay on track with your social media goals:
CPM (cost per thousand impressions)
Since brand mentions are more relevant to organic social media marketing, CPM is a core metric for the paid side of social media. With social media advertising comes what feels like infinite potential for your targeting—making it easy to hit thousands of impressions on an ad.
Measuring your CPM clues you in on how much spend you need to reach that one thousand impression threshold and get more eyeballs on your ad. After all, users can’t click and convert on an ad they’ve never seen!
5. Website metrics
Your website pulls all your marketing strategies together. You can have the strongest emails, ads, or social posts in the world, but if your website is not optimized, you’ll have no way of converting your audience into customers. Similar to content marketing metrics, you can find many of these website metrics in Google Analytics.
Here are some important website metrics to track:
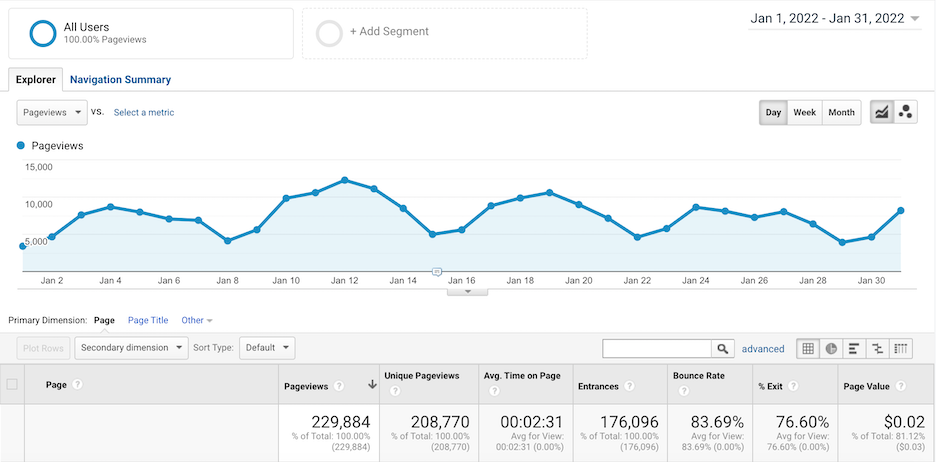
Pageviews
Think of this website marketing metric as the “godfather” of optimization metrics. As funny as it sounds, pageviews equate to website traffic and with traffic comes results. Pageviews are the total number of times a page is loaded and looked at.
You can measure pageview totals across your site, or pageviews of an individual URL, to understand traffic patterns and the popularity of certain types of content. Tracking pageviews could point you to where you need to optimize for SEO and more for a fail-proof website.
Related: Want more tips to improve your SEO and boost pageviews? Check out our quick guide to SEO success.
Time on site
Time on site is the average amount of time an individual spends on pages across your website. The longer this marketing metric is, the better. This could mean your visitors are interested in your content, looking to learn more about your business, or considering becoming a customer.
Bounce rate
Sadly, this marketing metric isn’t measuring the number of bouncy balls your website brings in. Instead, bounce rate measures something of much higher value for growing businesses: where you lose traffic. Bounce rate is the percentage of users who land on a page and leave without ever visiting another page. For example, if you notice a high bounce rate on a product page, it could mean your page isn’t impactful or relevant enough. The user is arriving on the site and immediately leaving without visiting another page.
Website conversions
While we touched on conversions earlier, it’s necessary to reiterate just how important this marketing metric is to the success of your website. Without a strong conversion rate optimization plan in place, your website won’t be able to achieve that core goal of converting prospects into customers.
Remember that you decide the desired action you want your visitors to complete, so adjust your website copy to include enticing call-to-actions and a clear path to conversion.
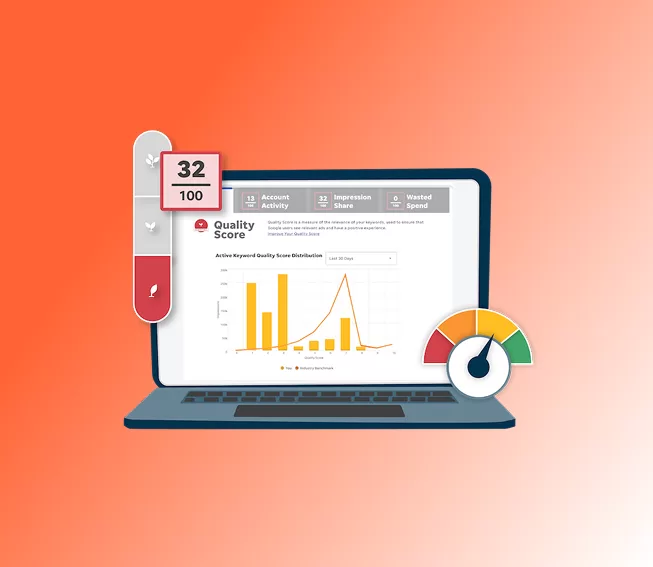
Find other ways you can optimize your website for conversions with our free, instant website grader!
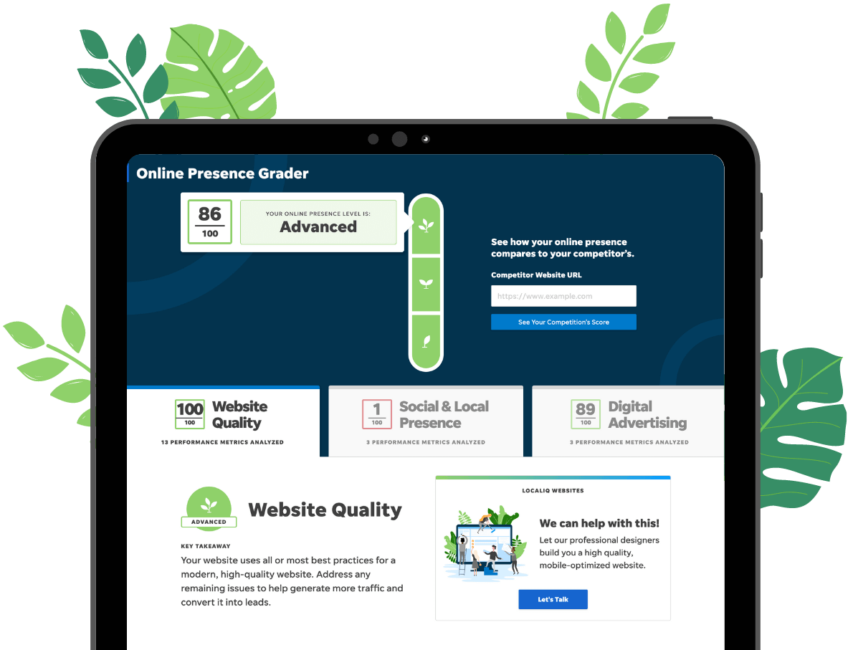
An example of a website grade using LOCALiQ’s free tool that can help find conversion rate optimization opportunities.
Rich reporting = riveting results!
Maneuvering marketing metrics wasn’t so bad after all! When you know where to look and what to look for with this handy breakdown, your marketing reporting will be unstoppable. If you don’t want to spend time tracking all your marketing metrics on your own, there are plenty of online reporting tools and marketing partners at the ready to help your business reach its full potential.