


A LocaliQ survey of over 1,900 adults who’ve traveled within the last 12 months found that leisure travel continues to dominate the industry, with even business travelers looking to add leisure activities to their work trips. This was just one key finding from our travel study on how people learn about destinations and services and what motivates them to make travel decisions.
LocaliQ’s 2026 travel industry study provides a deep dive into:
- The top activities and amenities travelers seek out.
- Which experiences and perks they’ll pay a premium for.
- What motivates them to book (or keeps them from doing it).
- And much more!
This exclusive data highlights the modern traveler’s path from inspiration to reservation, and forms the foundation of a marketing strategy that meets them where they get information and inspiration for their next journey. Here, we’re exploring the top takeaways from our study and what they mean for your travel marketing.
Contents
- Key findings from our travel marketing study
- Leisure travel dominates the industry
- Travel planning is personal and intentional
- Travel is driven by experiences, not just by destinations
- International travel demand is strong but varies by generation
- Safety is a non-negotiable and key decision driver
- Cost remains the biggest barrier, but travelers are still willing to spend strategically
- Digital discovery drives action, especially on social media
- Social media is the most popular channel for travel advertising (with the highest ad recall)
- Most travelers book directly through providers’ sites
- Trust and price are the most important factors when choosing travel providers
- Travelers are searching for the best deals
- More travel and tourism marketing stats to drive your strategy
- Travel marketing infographic
11 findings from our travel and tourism study (+what they mean for your marketing)
Let’s take a tour of the most influential data from our study and map out what it means for your travel marketing strategy.
1. Leisure travel dominates the industry
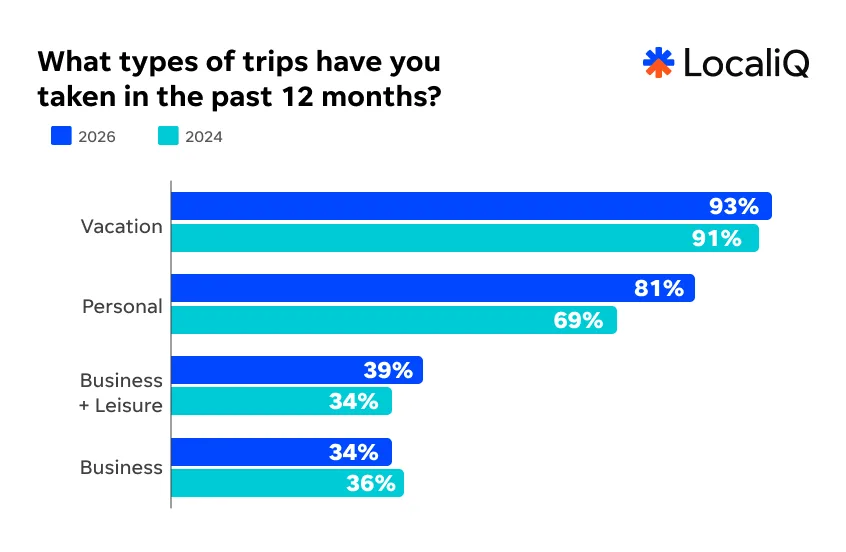
Travel is back, and then some. In our survey, 93% of respondents said they took a vacation in the past 12 months, up from 91% in 2024. Personal travel also jumped significantly, from 69% to 81%.
Business travel took a slight hit, but “bleisure” travel—trips that mix business and personal time—ticked up, from 34% to 39%.
What this means for your marketing
Your potential audience is large and growing. With 9 in 10 consumers taking at least one vacation last year, the job is less about encouraging people to travel and more about making sure they choose your experience or location. That means showing across platforms. And if you can show business travelers how to get a little R&R after work is done, they may extend their trip.
2. Travel planning is personal and intentional
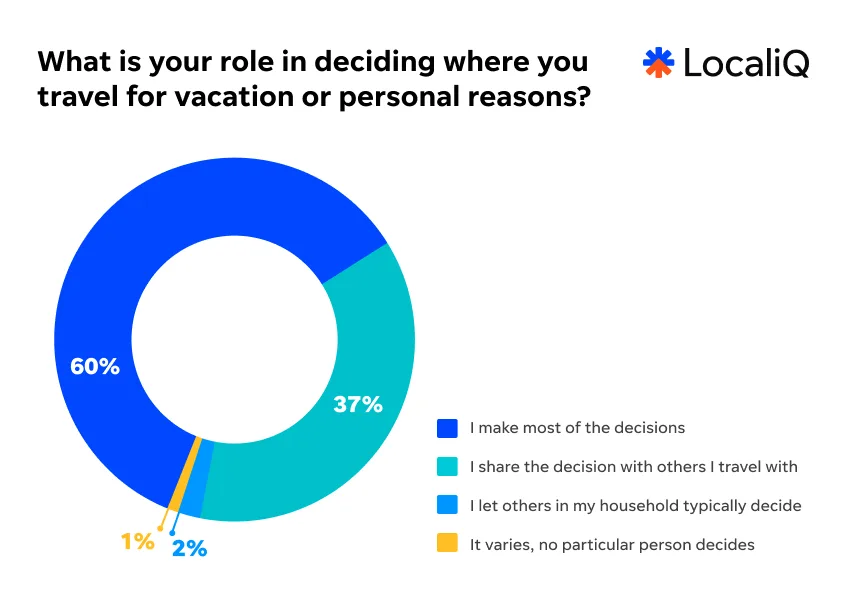
The vast majority of people have input in their trips. 60% of respondents say they make most of their own travel decisions. With another 37% sharing the process with travel companions, nearly everyone is involved in choices about where they go and how they get there.
What this means for your marketing
Since nearly everyone is involved in their travel decisions, you’ll need to tailor distinct messages for each person going on a trip. That means a single resort may need multiple campaigns to highlight different aspects of its experience so young parents, retired couples, or solo travelers all see value in the visit. This is where market segmentation and a deep understanding of your customers become critical.
🛑 What are the biggest challenges businesses are facing? Find out that and more in our Small Business Marketing Trends Report.
3. Travel is driven by experiences, not just by destinations
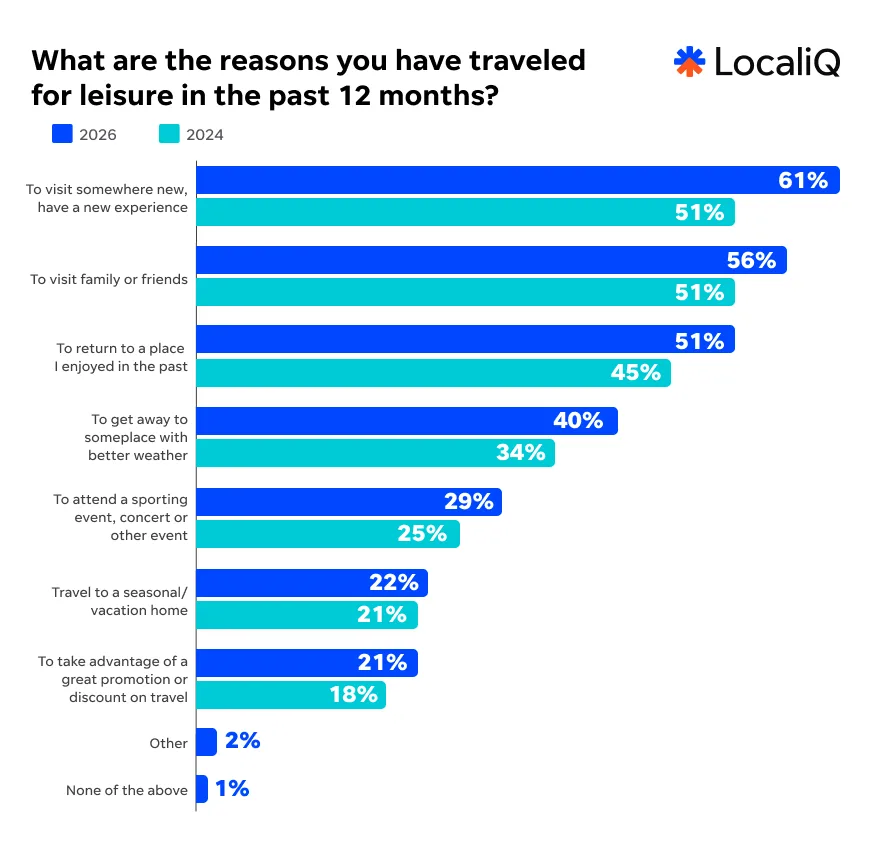
The top reasons people traveled for leisure in the past year were to have a new experience (61%), visit family or friends (56%), and return to a favorite place (51%). All three segments grew meaningfully since 2024.
Chasing better weather (40%) and attending events like concerts or sporting events (29%) also ranked high. While only 21% of people say that a great deal or promotion motivated them to travel, that is still an increase from 2024.
What this means for your marketing
Focus your content and ads to tap into specific travel motivations. A campaign built around the reunion, the adventure, or the annual beach trip will land better than one that simply describes amenities. If you offer deals, they’re worth promoting, as more travelers say a great promotion was reason enough to book.
4. International travel demand is strong but varies by generation
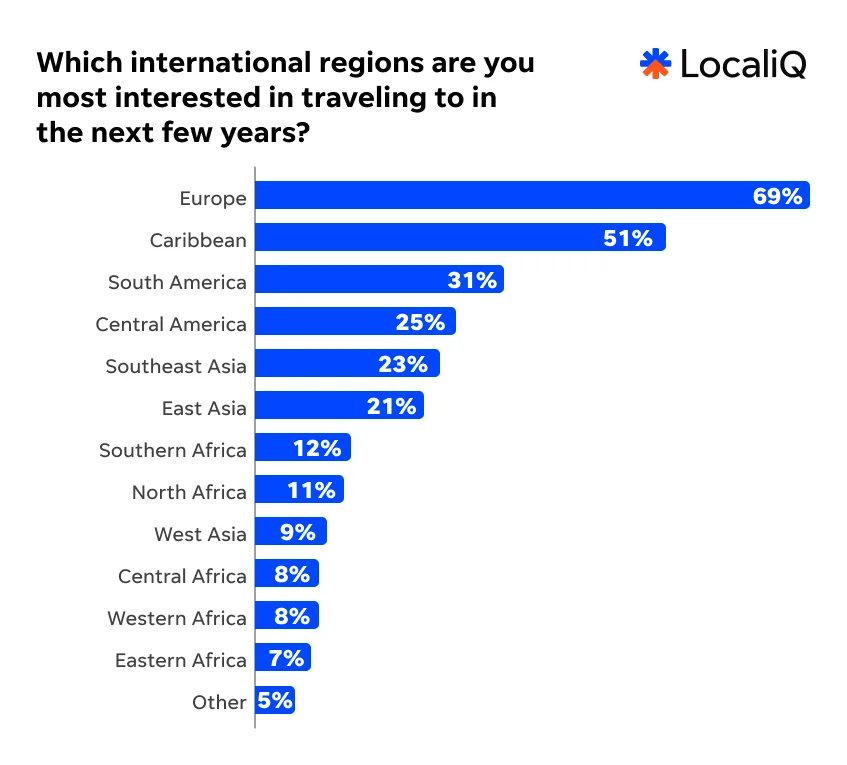
When it comes to international travel, Europe remains the clear frontrunner. 69% of respondents said it’s on their list for the next few years. The Caribbean is a distant but solid second at 51%. Destinations like South America (31%), Central America (25%), and Southeast Asia (23%) also draw significant interest, particularly among younger travelers. Travelers 60 and older tend to stick closer to the familiar, gravitating toward Europe and the Caribbean.
What this means for your marketing
Destination interest varies a lot by age, so broad campaigns tend to leave money on the table. If you’re promoting international travel, targeting by age group lets you match the destination to the audience most likely to book it. Europe and Caribbean content for older travelers, more adventurous, “off the beaten track” destinations for younger ones.
5. Safety is a non-negotiable and key decision driver
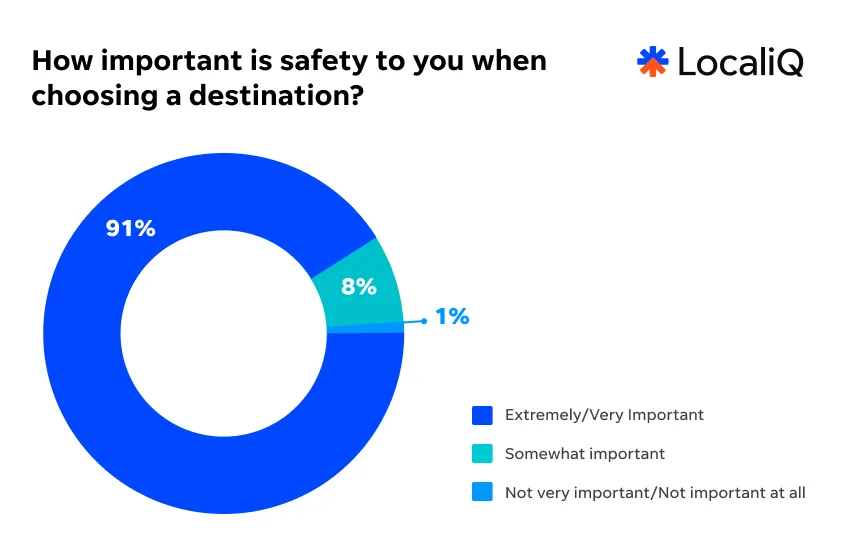
91% of travelers say safety is extremely or very important when choosing a destination, making it one of the strongest filters in the entire decision process. When travelers look for safety information, crime and security updates top the list (72%), followed by health concerns (61%).
What this means for your marketing
Brands that address safety concerns directly will remove one of the biggest sources of friction for travelers choosing where to go. If your destination or service has a strong safety record, say so explicitly. Travelers are actively looking for this reassurance, and providing it through content, FAQs, or ad messaging builds the kind of trust that moves people from browsing to booking.
This could be a great place to include targeted user-generated content so travelers can see people like them enjoying a safe experience.
6. Cost remains the biggest barrier, but travelers are still willing to spend strategically
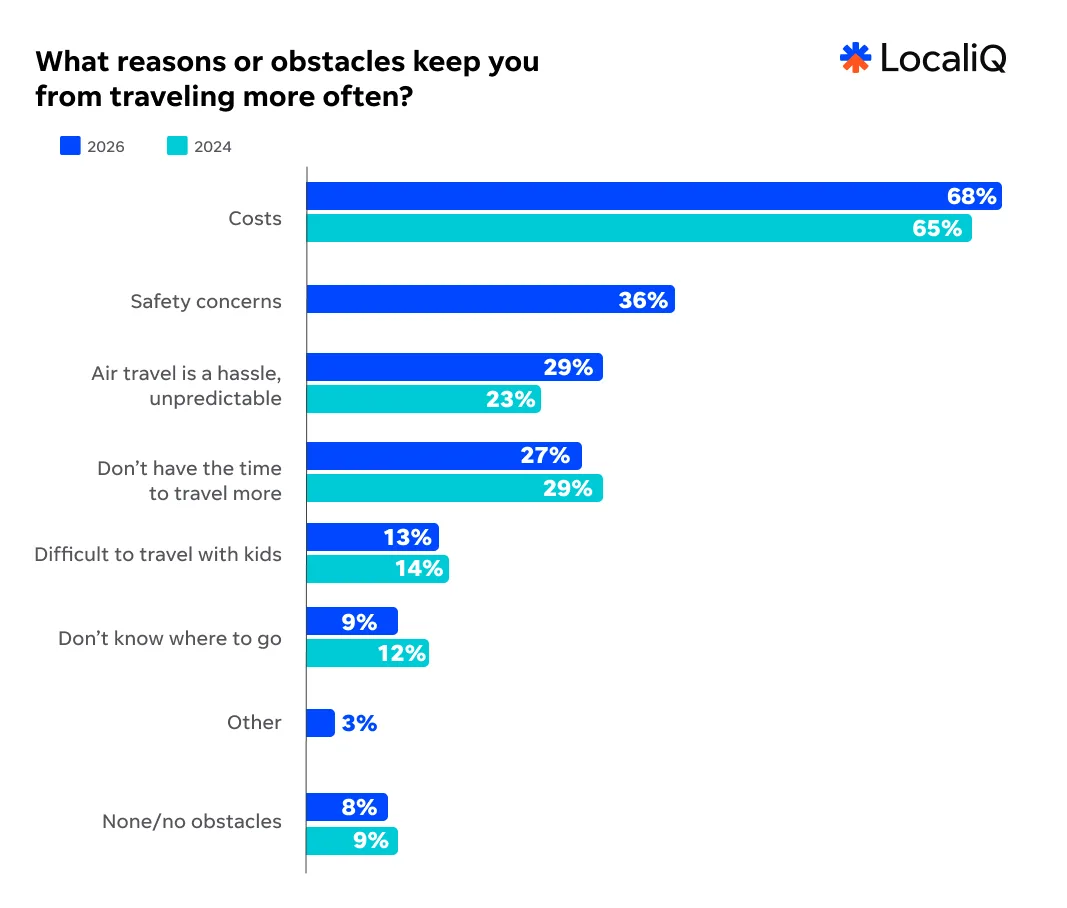
Cost is the number one obstacle keeping people from traveling more, cited by 68% of respondents, up from 65% in 2024. Safety concerns (36%) and the general hassle of air travel (29%) also rank high. But price sensitivity doesn’t mean travelers are trading down.
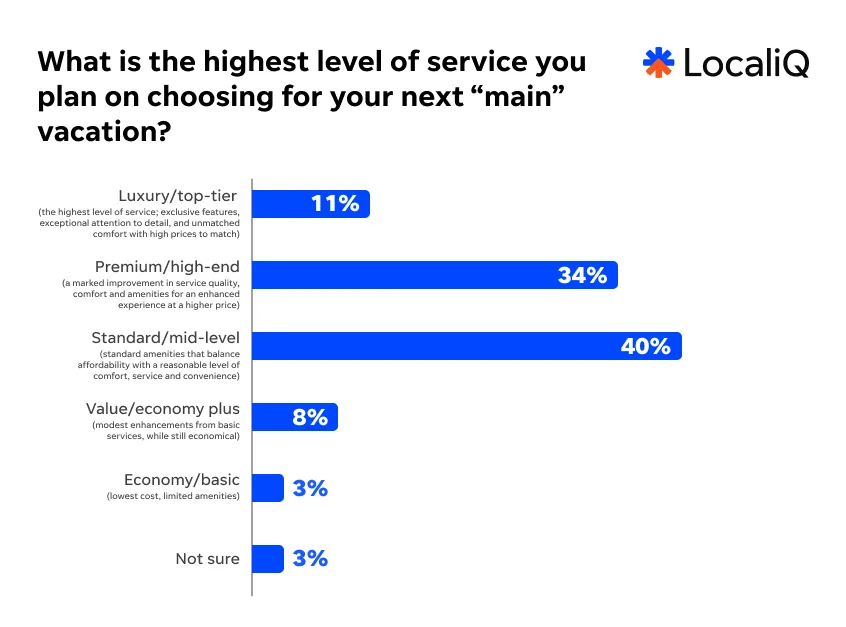
Nearly half (45%) plan to book premium or luxury service levels for their next main vacation.
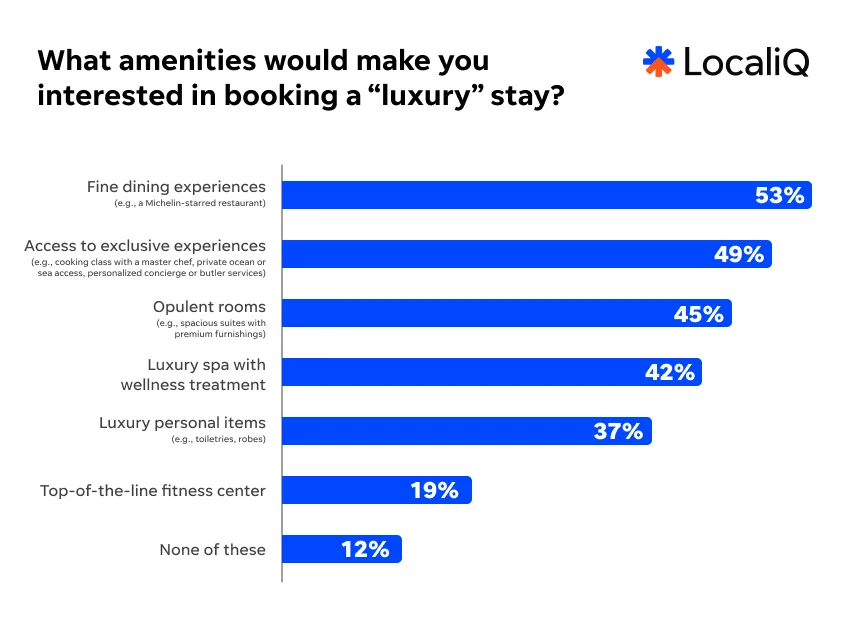
When it comes to what makes a luxury stay worth booking, fine dining (53%), access to exclusive experiences (49%), and upscale rooms (45%) lead the way.
What this means for your marketing
Showing value clearly in your messaging matters more than ever, but that doesn’t mean competing on price alone. A significant portion of your audience is actively looking to upgrade their experience. If you offer premium amenities, lead with the specifics like a standout dining experience or exclusive access. That tends to be more persuasive than a generic “luxury” label.
👋 Free guide: 37 Ways to Promote Your Business (Whatever Your Budget!)
7. Digital discovery drives action, especially on social media
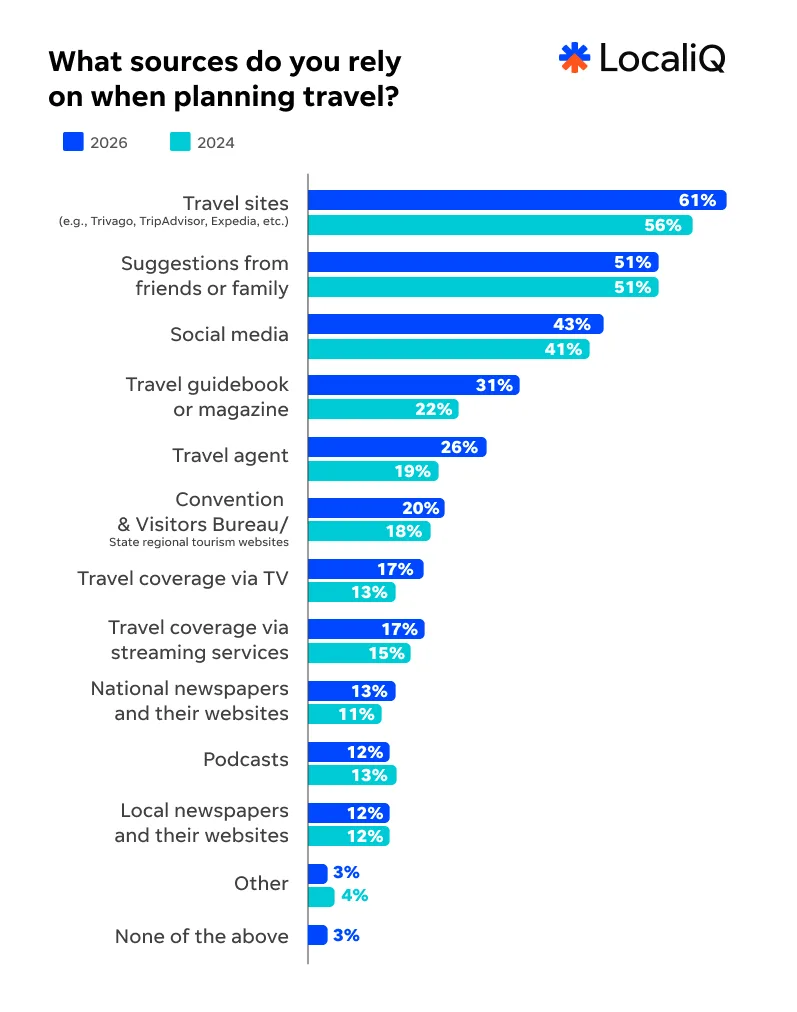
When planning travel, 61% of respondents turn to travel sites like TripAdvisor, Expedia, and Trivago, up from 56% in 2024. Friend and family recommendations hold steady at 51%. Social media has grown to 43% and skews even higher among younger travelers.
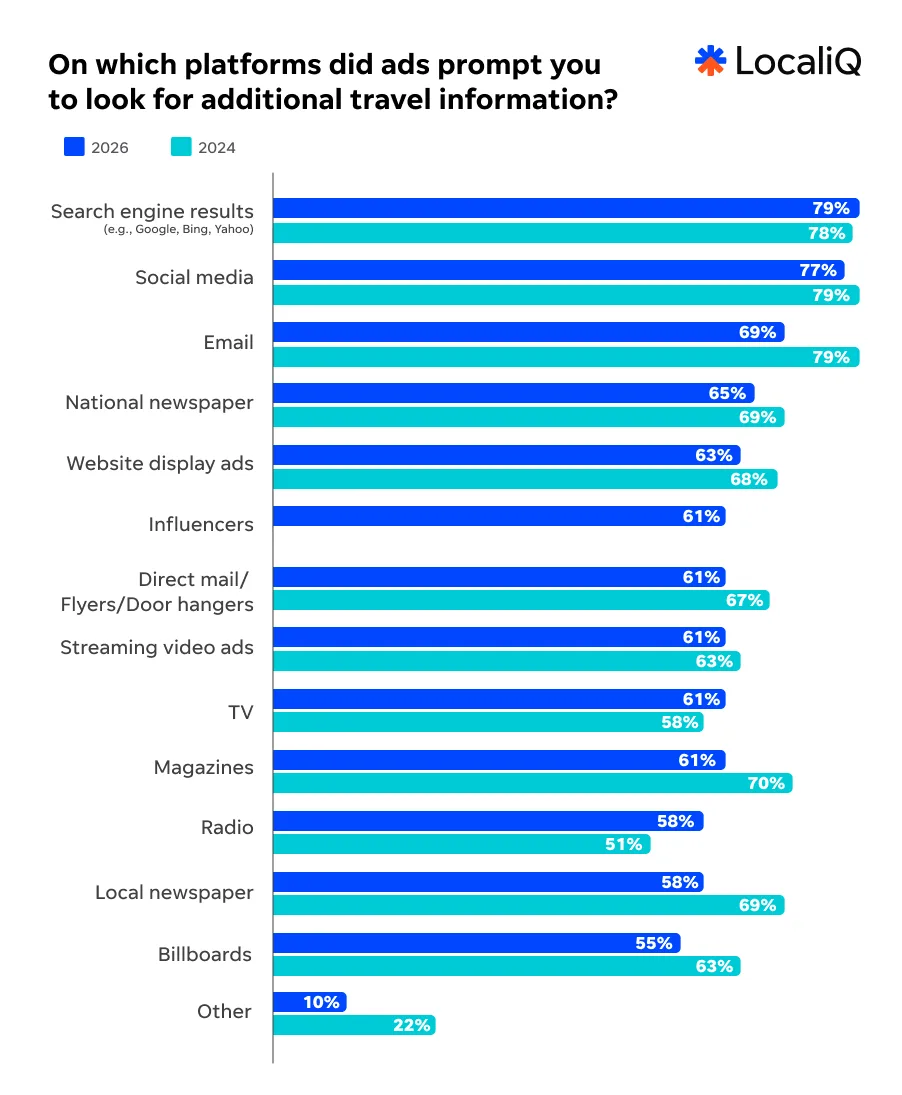
When ads do reach travelers, search and social are the platforms most likely to prompt them to dig deeper. Search engine ads nudged 79% of respondents to look for more information, a slight increase.
Interestingly, the influence of social media ads dipped, although only by a small margin (from 79% to 77%). Ads in national newspapers remain influential with a large number of travelers (65%).
What this means for your marketing
Travelers are doing their homework before they book, and they use several platforms in the process. Showing up in search results and maintaining an active social presence puts you in the mix early. Meanwhile, ad spend invested across multiple channels will pay dividends and make sure you’re getting the repeat encounters that solidify awareness.
8. Social media is the most popular channel for travel advertising (with the highest ad recall)
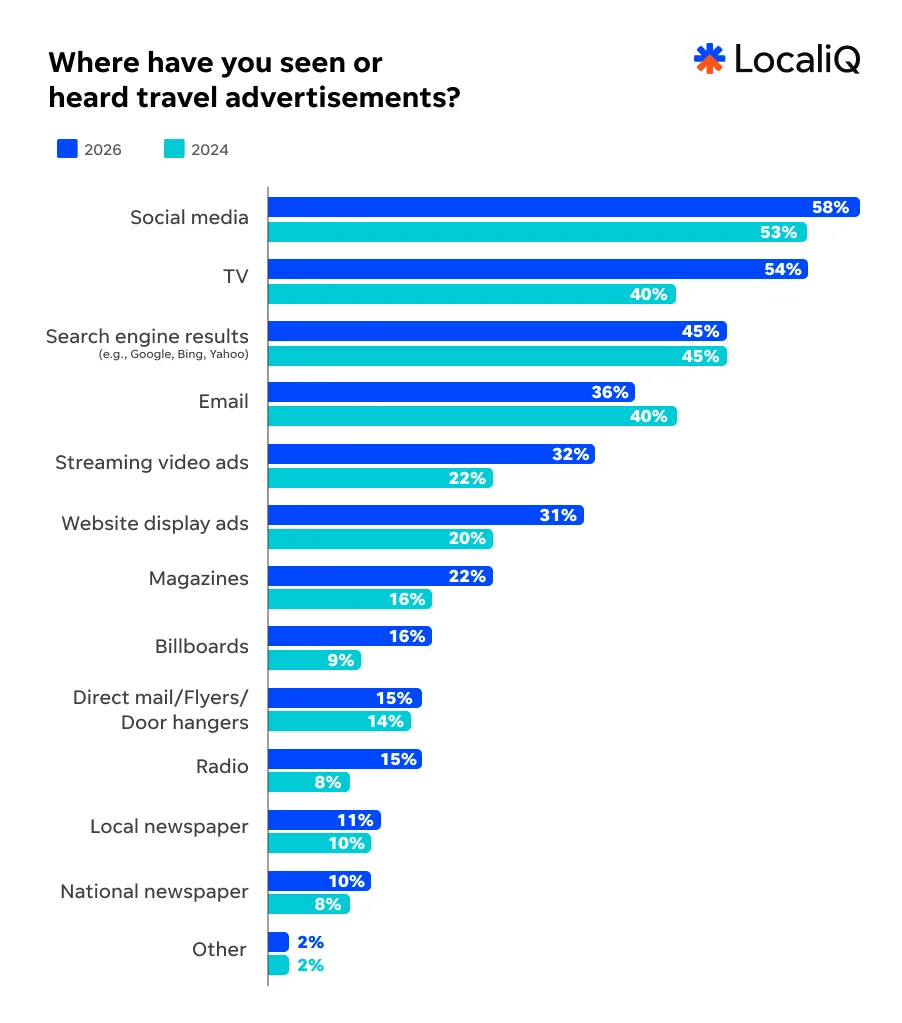
Social media is where travelers are most likely to see and remember travel ads, with 58% recalling ads there, up from 53% in 2024. TV comes in second at 54%, a notable jump from 40% two years ago. Search engine results (45%) and streaming video (32%) round out the top four, with streaming showing strong growth since 2024.
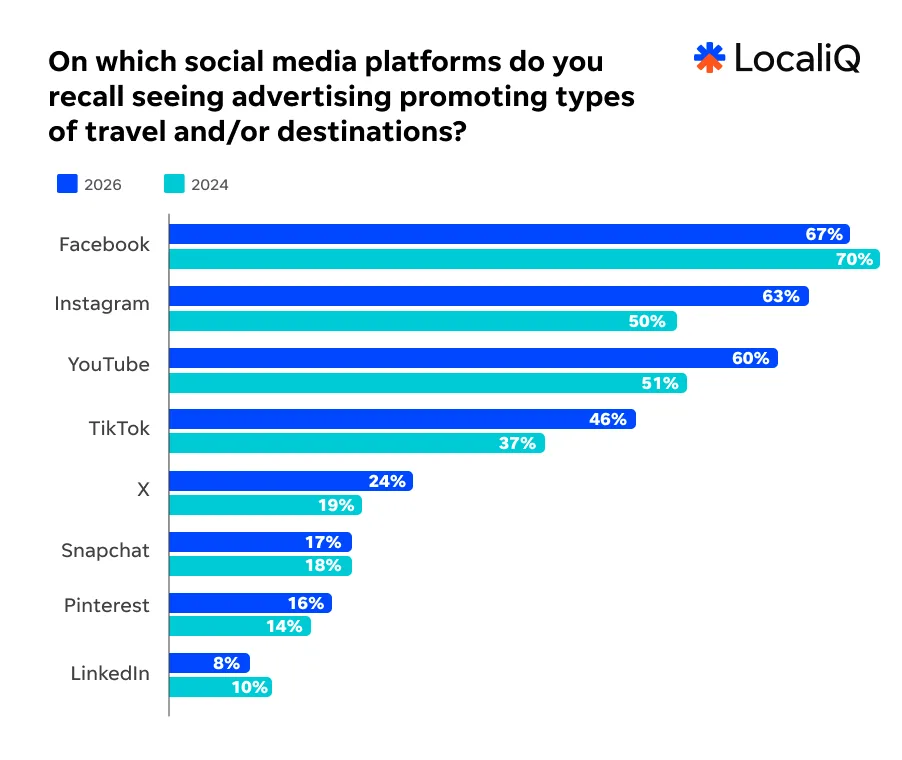
On social media specifically, Facebook leads ad recall at 67%, followed by Instagram at 63% and YouTube at 60%. TikTok has also grown significantly, rising from 37% to 46% since 2024.
What this means for your marketing
This data shows that social media advertising should play a significant role in your marketing mix. Facebook, Instagram, and YouTube deliver the strongest recall among social networks.
TikTok’s jump is worth paying attention to, particularly if younger travelers are part of your target audience. There’s also a growing case for TV ads, especially as you can hyper-target them through streaming services.
9. Most travelers book directly through providers’ sites
61% of travelers book directly through an airline, hotel, or resort website or app, with online travel sites like Expedia and Booking.com nearly as popular at 60%. Search engines play a significant role too, with 41% using them to find and then book through a linked provider. Loyalty and rewards portals have carved out a solid share at 38%, a reminder that repeat customers are actively looking to use their points.
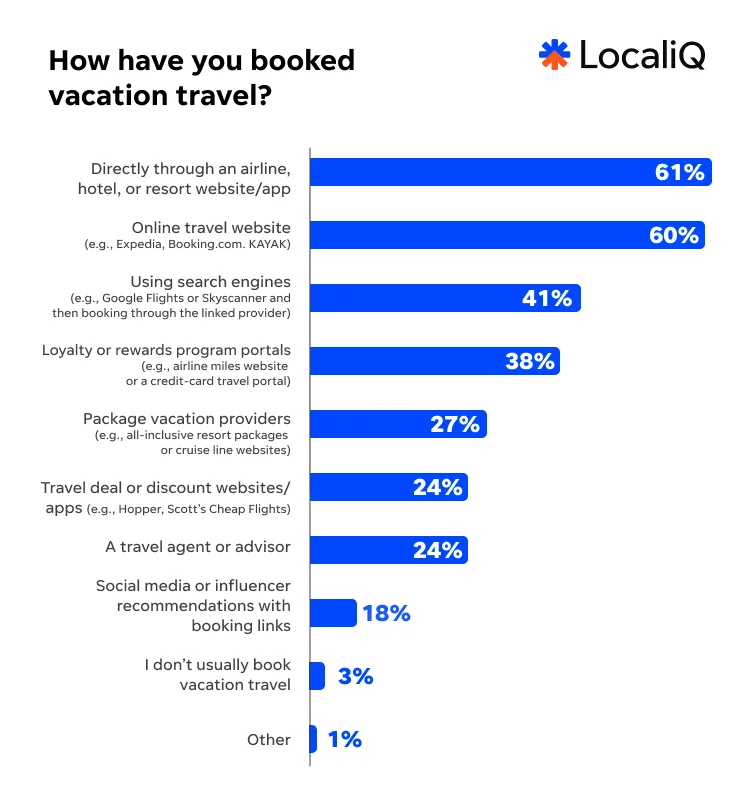
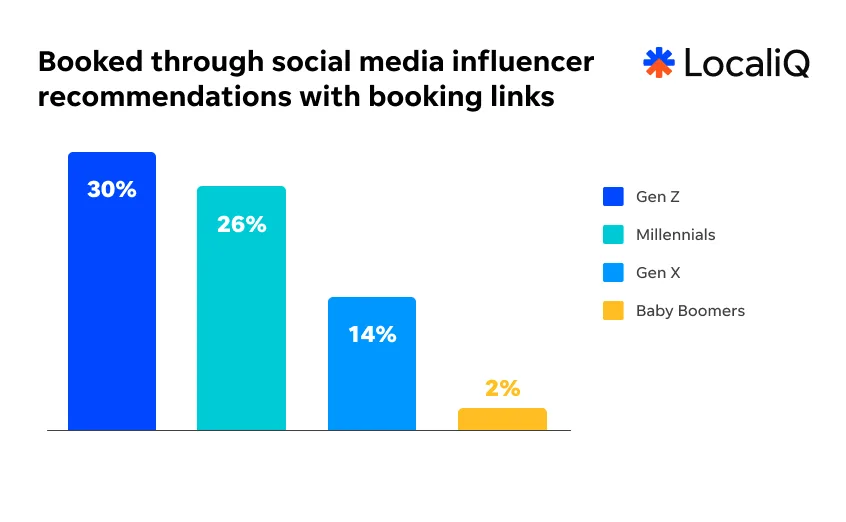
Social media and influencer bookings are still a small slice overall at 18%, but the generational split is striking. 30% of travelers ages 18 to 29 have booked through social media or influencer recommendations, compared to 26% of those ages 30 to 44, dropping to 14% for ages 45 to 59, and just 2% for travelers 60 and older.
What this means for your marketing
Having a clean, easy-to-book direct website or app is still the most important conversion tool you have. For younger audiences, though, influencer partnerships and social media booking links are worth testing. If you’re targeting travelers under 45, that path to purchase is already established for a meaningful share of them.
10. Trust and price are the most important factors when choosing travel providers
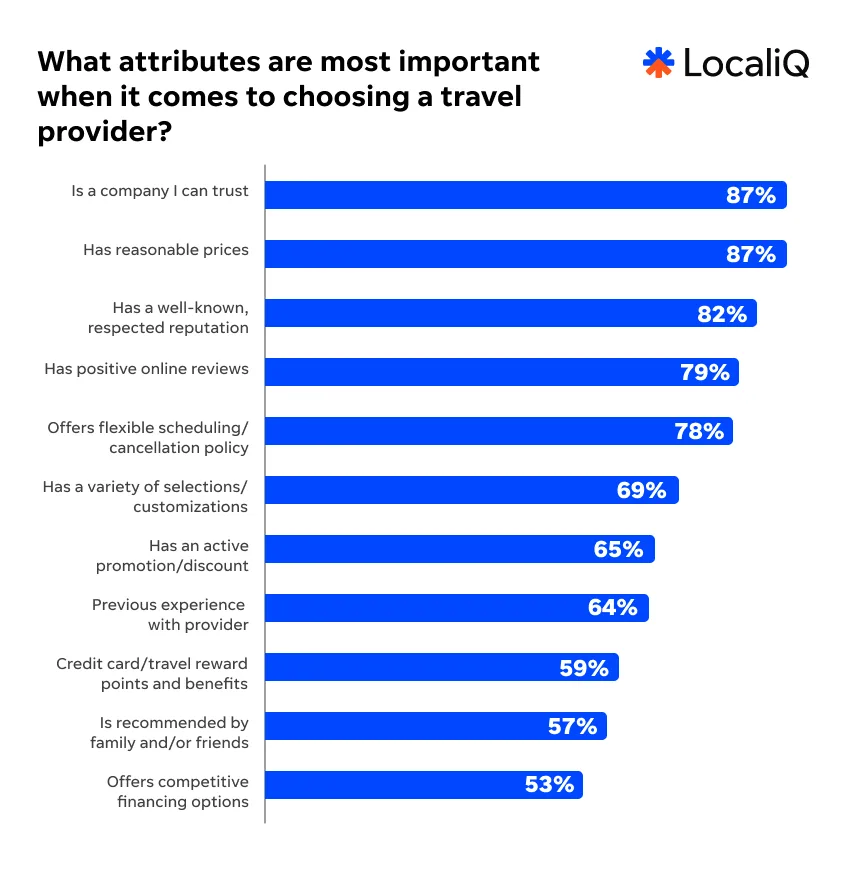
Trust and reasonable prices are tied at the top, each cited by 87% of travelers as important when choosing a provider. A well-known, respected reputation (82%) and positive online reviews (79%) follow closely, reinforcing that credibility matters at every touchpoint. Flexible cancellation policies rank high too, at 78%, a sign that travelers want confidence they can adjust plans if needed.
What this means for your marketing
Your reputation is doing as much selling as your ads. Actively managing your online reviews, showcasing your cancellation policy, and leading with trust signals in your messaging will carry more weight than most other things you can do. Travelers are doing their homework before they book, and what they find out about you away from your website is incredibly influential.
11. Travelers are searching for the best deals
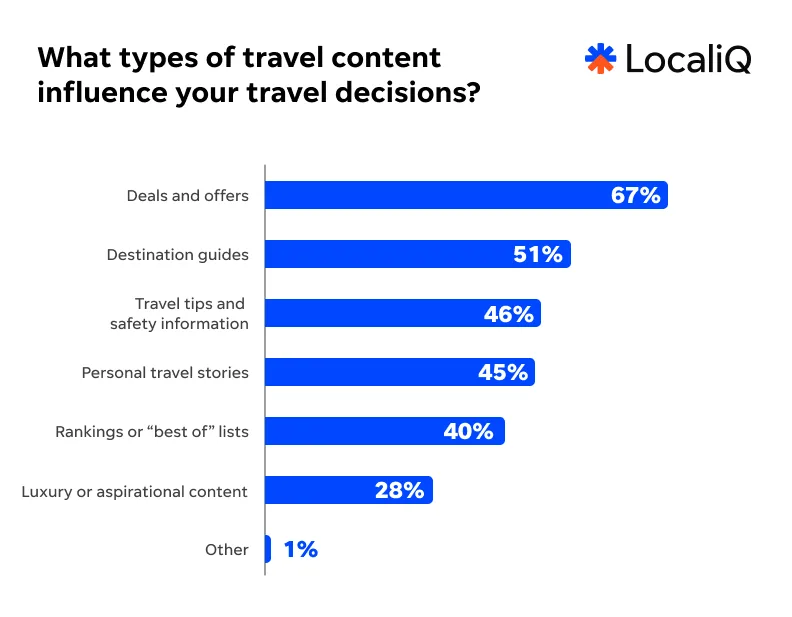
Deals and offers are the most influential type of travel content by a wide margin, cited by 67% of respondents. Destination guides (51%), travel tips and safety information (46%), and personal travel stories (45%) also rank high, giving travel marketers a clear content roadmap.
Travelers are also actively working the loyalty angle. Hotel rewards programs have seen a big jump, with 52% of respondents enrolled, up from 40% in 2024. Frequent flyer programs grew similarly, from 31% to 40%.
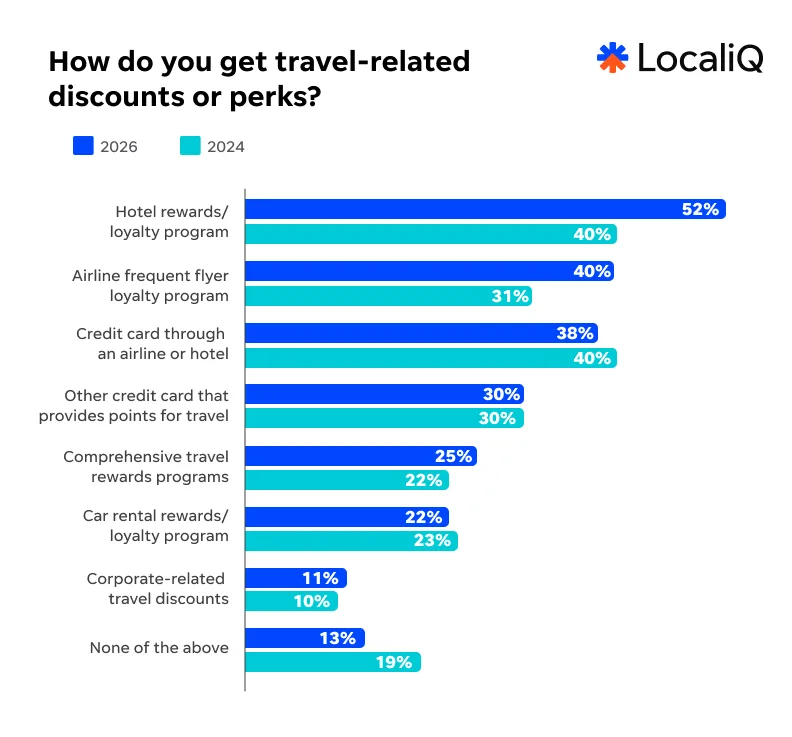
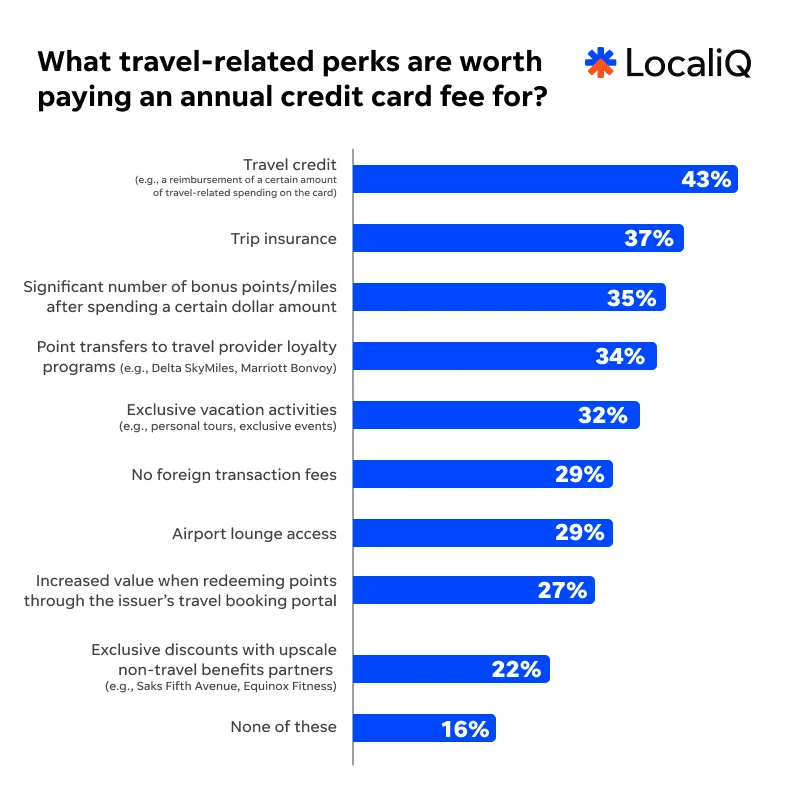
And 43% say travel credit alone is worth paying an annual credit card fee for, with trip insurance (37%) and bonus points (35%) also ranking as compelling perks.
What this means for your marketing
If you have deals, promote them prominently since they outperform every other content type when it comes to influencing decisions. If you have a loyalty or rewards program, make sure it’s visible in your ads and on your site and actively recruit customers to join. Travelers are enrolled in these programs at higher rates than ever, and they’re actively looking for ways to use them.
More travel and tourism marketing stats to drive your strategy
We’ve explored our top travel findings, but there were many more stats from our study to help guide your marketing strategy.
Stats about travel behavior
- About 46% of business travelers always or often add vacation or leisure time to their trip; 30% do so sometimes.
- Roughtly 60% of leisure travelers are most likely to travel with their spouse or partner.
- 53% of people are extremely or very interested in multigenerational travel.
- Younger travelers (54% ages 18-29, 53% ages 30-44) are most open to traveling with an affinity group.
- 89% of travelers have stayed in a hotel in the past year; 50% have stayed at a by-owner rental like Airbnb or Vrbo.
- 70% of people have traveled domestically by air.
Travel preference stats
- 64% of travelers look for destinations within driving distance when planning vacation travel.
- 63% of travel consumers look for family-friendly destinations; 57% look for couples-friendly destinations.
- 55% of trip planners look for destinations near national parks.
- Beach trips (73%), shopping (66%), and visiting friends/family (65%) are the most popular vacation activities.
- Older travelers take longer vacations; lower-income travelers tend to vacation for fewer than 5 days.
Stats about trust and information sources
- Friends and family recommendations are trusted by 95% of travelers when planning.
- Travel sites are trusted by 92% of travelers.
- Travel agents are trusted by 91%, up from 88% in 2024.
- Social media is trusted by 78% of travelers who use it for planning.
Loyalty and rewards stats
- 55% of travelers are members of a hotel rewards program, up from 50% in 2024.
- 47% of travel consumers are members of a frequent flyer program, up from 38% in 2024.
- Most travelers (75%) are extremely or very interested in receiving special offers and discounted rates from travel providers.
- Higher-income travelers ($100k+) are significantly more likely to use airline and hotel credit cards and loyalty programs.
Travel marketing infographic
Here’s a round-up of some of the most important takeaways from our study in a convenient infographic.

Experience better travel marketing
The travel industry continues to experience growth. However, travelers are educated and influenced by more sources and channels than ever. The data from our study can help you understand these shifts to engage with travelers in more meaningful ways throughout their planning process.
We can provide deeper, more granular insights and support to help you create and execute the perfect marketing strategy. Reach out to speak with one of our travel marketing experts to learn how.

Recommended for you



Unlock your business potential
We offer innovative technology and unparalleled expertise to move your business forward.